

Immediate and Complex Cardiovascular Adaptation to an Acute Alcohol Dose
- PMID: 26614647
- PMCID: PMC4971776
- DOI: 10.1111/acer.12912
Immediate and Complex Cardiovascular Adaptation to an Acute Alcohol Dose
Abstract
Background: The detrimental effects of chronic heavy alcohol use on the cardiovascular system are well established and broadly appreciated. Integrated cardiovascular response to an acute dose of alcohol has been less studied. This study examined the early effects of an acute dose of alcohol on the cardiovascular system, with particular emphasis on system variability and sensitivity. The goal was to begin to understand how acute alcohol disrupts dynamic cardiovascular regulatory processes prior to the development of cardiovascular disease.
Methods: Healthy participants (N = 72, age 21 to 29) were randomly assigned to an alcohol, placebo, or no-alcohol control beverage condition. Beat-to-beat heart rate (HR) and blood pressure (BP) were assessed during a low-demand cognitive task prior to and following beverage consumption. Between-group differences in neurocardiac response to an alcohol challenge (blood alcohol concentration ~ 0.06 mg/dl) were tested.
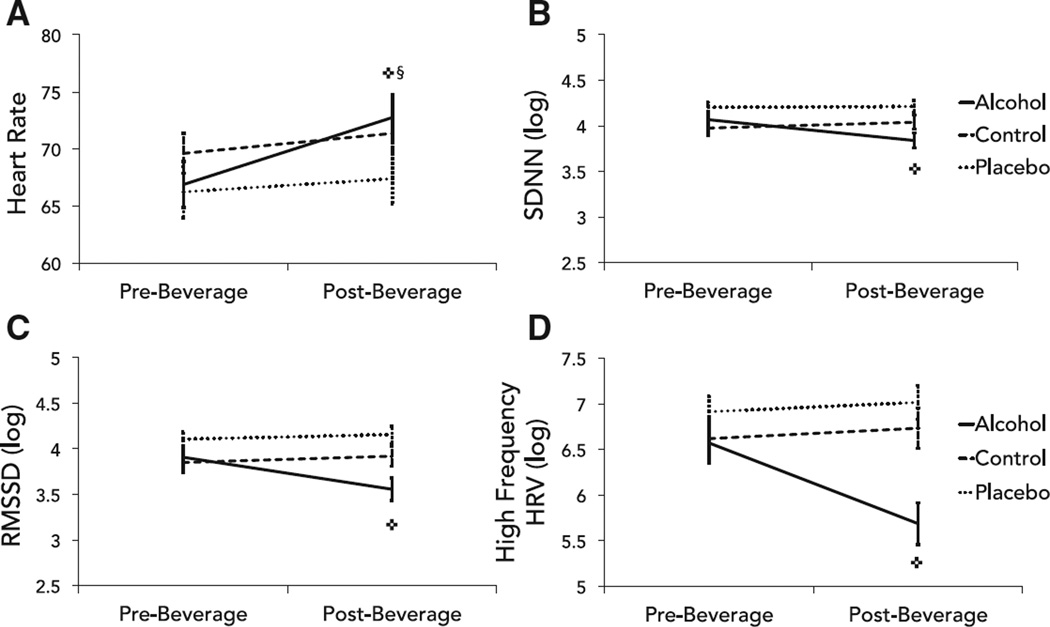
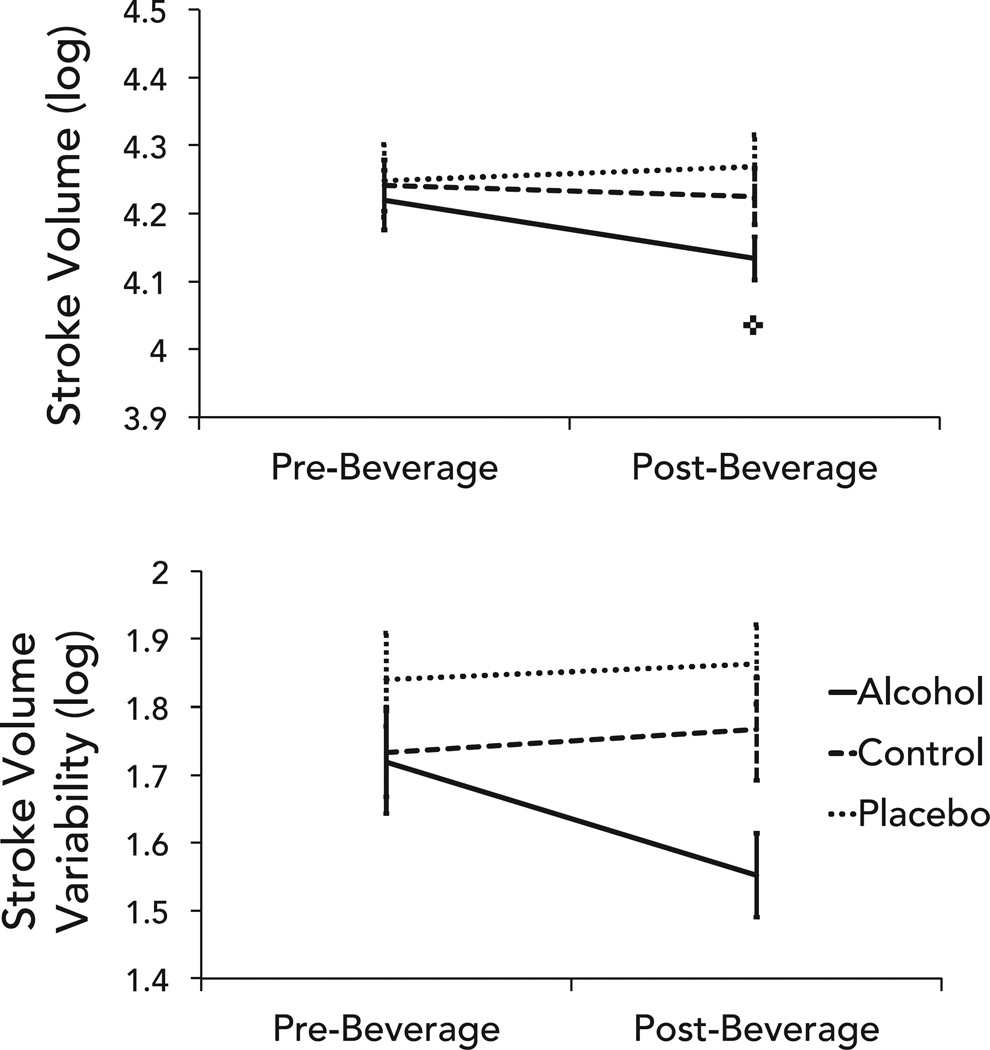
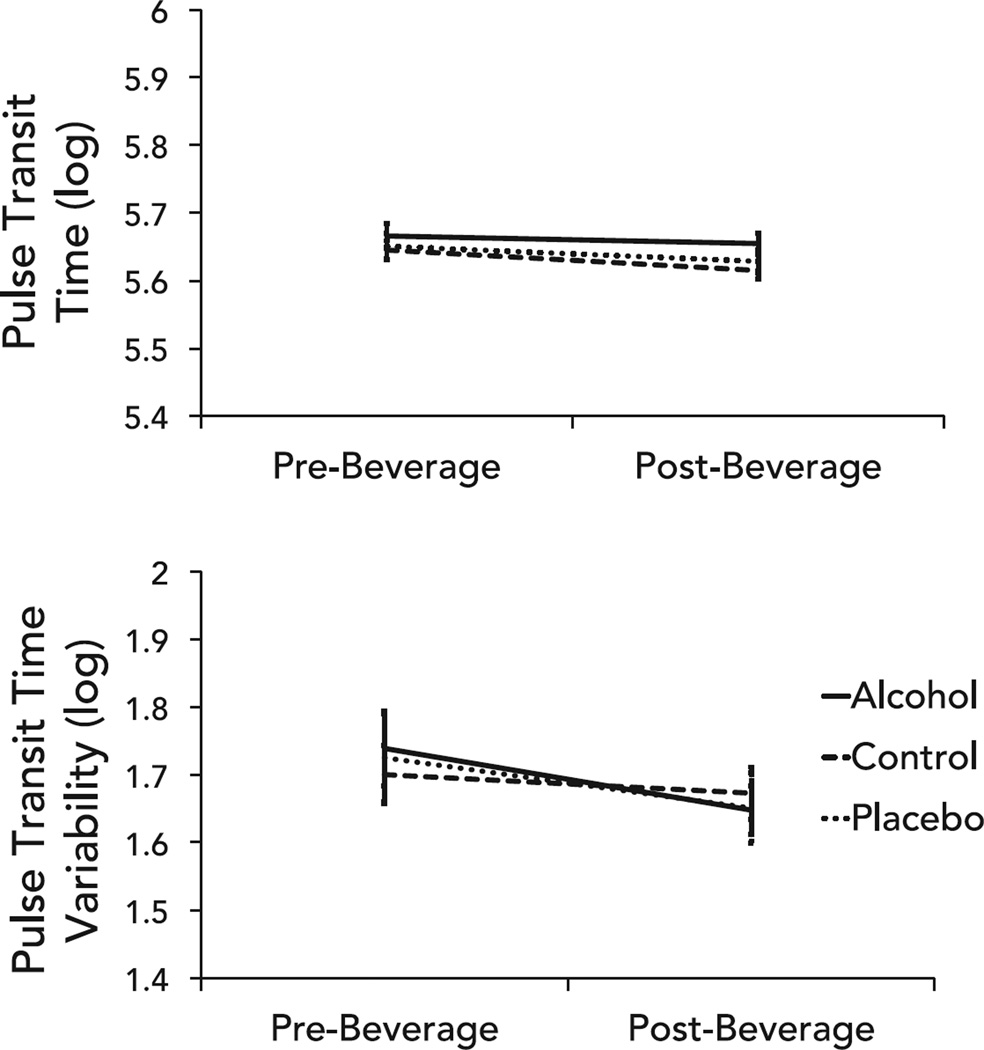
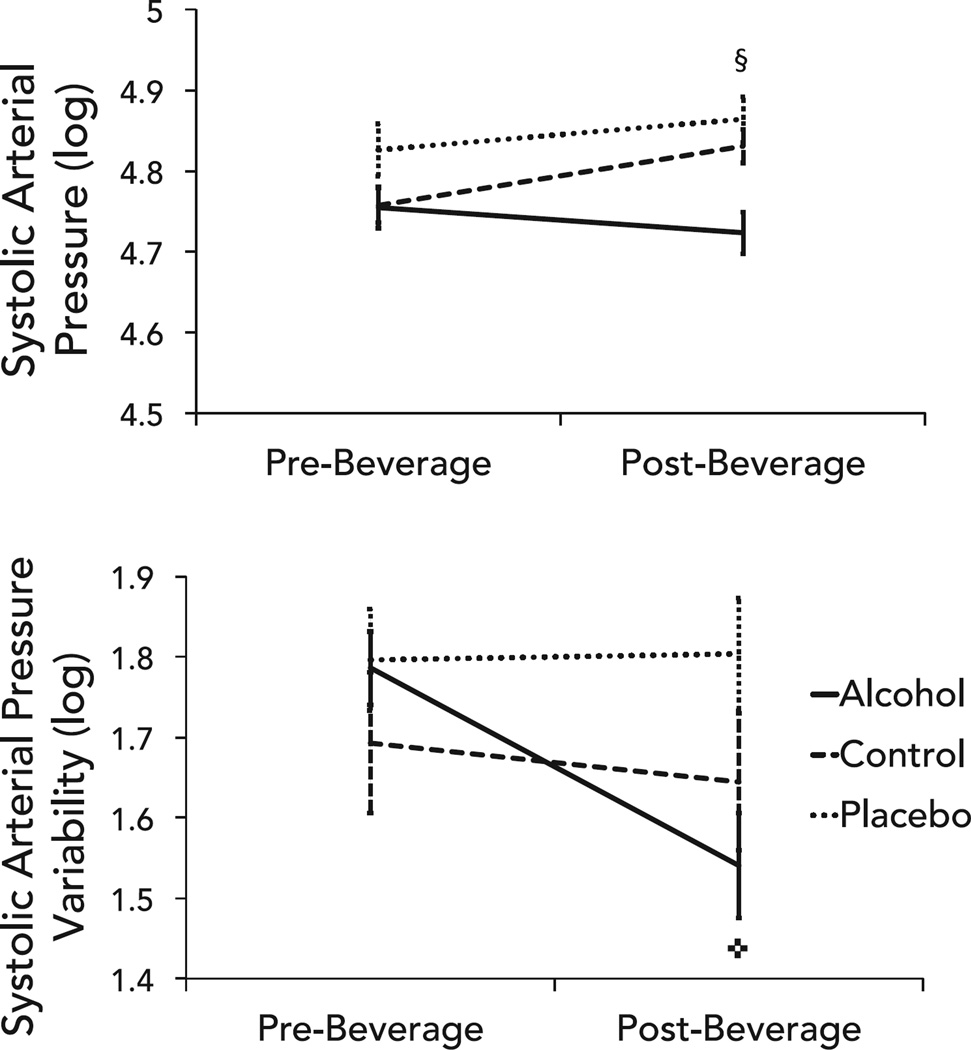
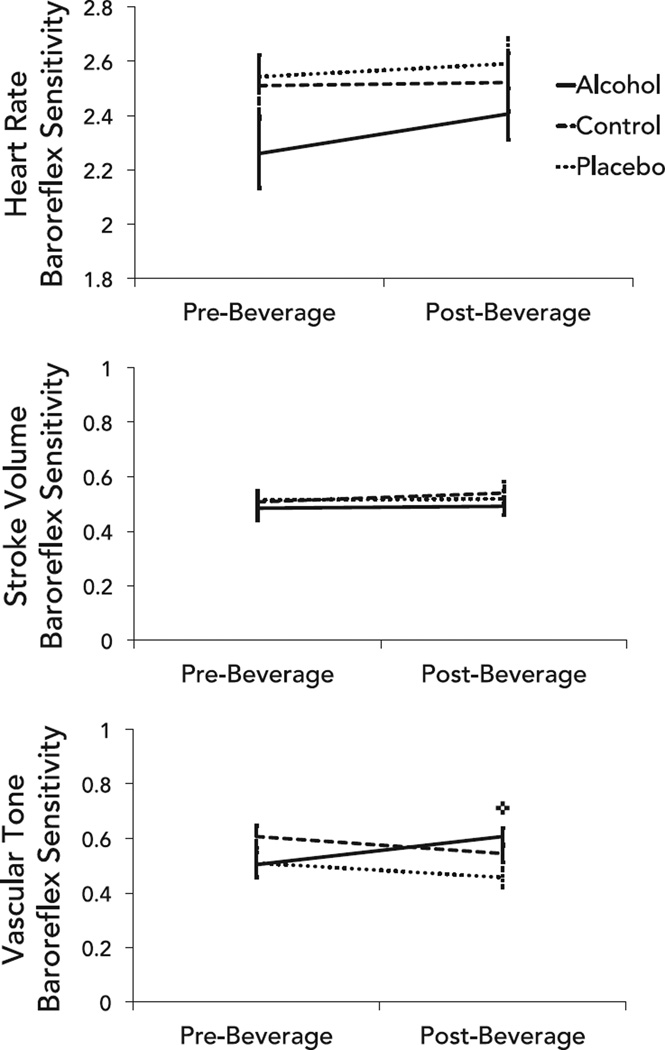
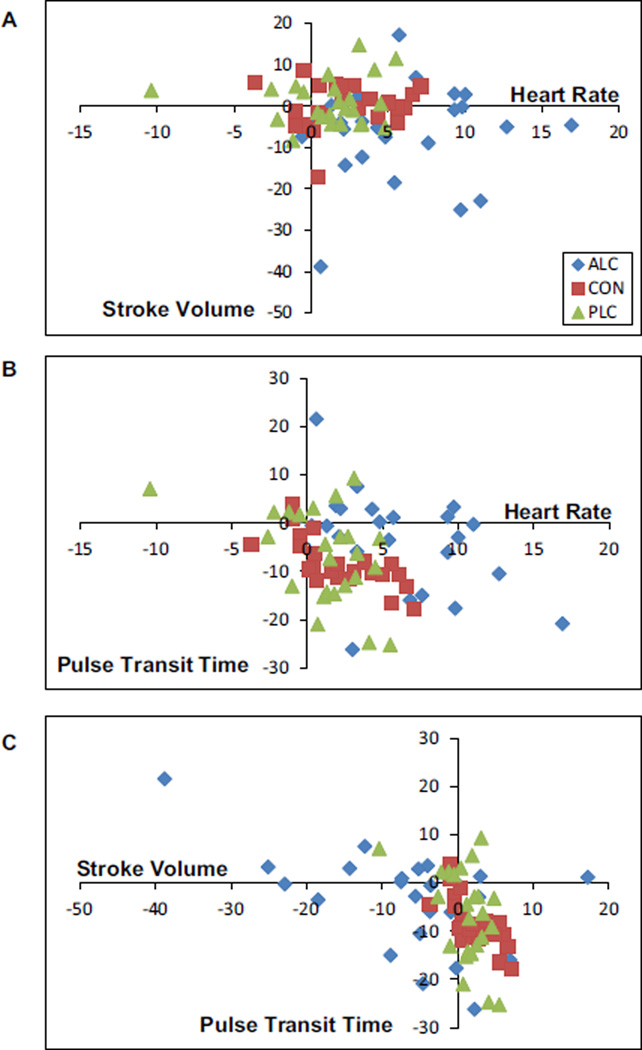
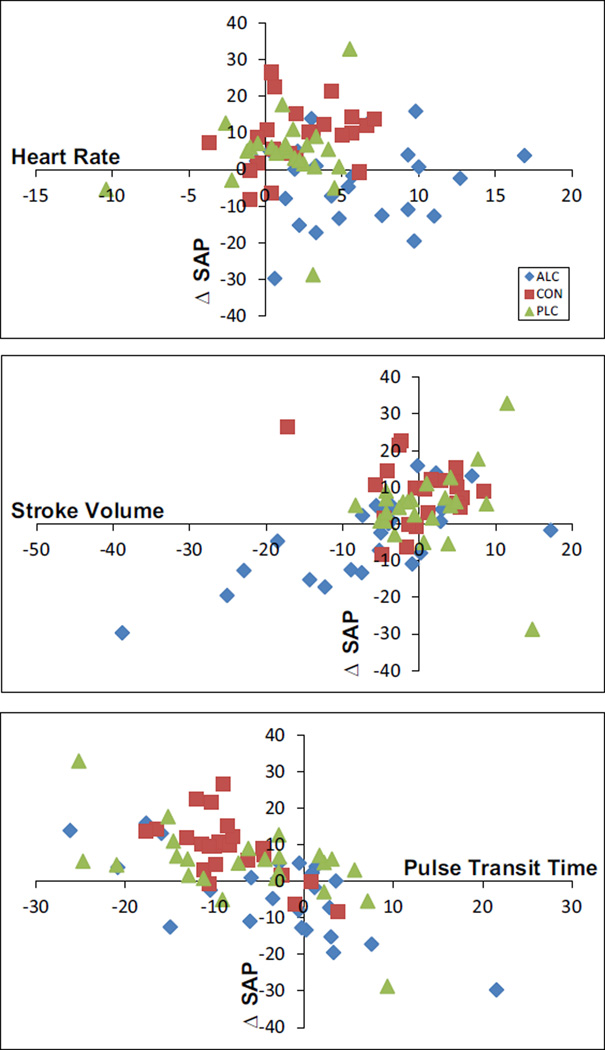
Results: The alcohol beverage group showed higher average HR, lower average stroke volume, lower HR variability and BP variability, and increased vascular tone baroreflex sensitivity after alcohol consumption. No changes were observed in the placebo group, but the control group showed slightly elevated average HR and BP after beverage consumption, possibly due to juice content. At the level of the individual, an active alcohol dose appeared to disrupt the typically tight coupling between cardiovascular processes.
Conclusions: A dose of alcohol quickly invoked multiple cardiovascular responses, possibly as an adaptive reaction to the acute pharmacological challenge. Future studies should assess how exposure to alcohol acutely disrupts or dissociates typically integrated neurocardiac functions.
Keywords: Baroreflex; Blood Pressure; Heart Rate Variability; Intoxication; Vascular Tone.
Copyright © 2015 by the Research Society on Alcoholism.
Conflict of interest statement
The authors declare no conflicts of interest.
Figures
References
-
- Agewall S, Wright S, Doughty RN, Whalley GA, Duxbury M, Sharpe N. Does a glass of red wine improve endothelial function? Eur Heart J. 2000;21:74–78. - PubMed
-
- American Heart Association. [Accessed November 13, 2015];Alcohol and heart health. 2015 Available at: http://www.heart.org/HEARTORG/GettingHealthy/NutritionCenter/HealthyEati....
-
- Bates ME, Martin CS. Immediate, quantitative estimation of blood alcohol concentration from saliva. J Stud Alcohol. 1997;58:531–538. - PubMed
-
- Bau PFD, Bau CHD, Naujorks AA, Rosito GA. Early and late effects of alcohol ingestion on blood pressure and endothelial function. Alcohol. 2005;37:53–58. - PubMed
-
- Beck AT. Beck Depression Inventory-II (BDI-II). The Psychological Corporation. San Antonio, TX: Harcourt, Brace and Company; 1996.
Publication types
MeSH terms
Substances
Grants and funding
LinkOut - more resources
Full Text Sources
Other Literature Sources
