

Development of a pharmacokinetic-guided dose individualization strategy for hydroxyurea treatment in children with sickle cell anaemia
- PMID: 26615061
- PMCID: PMC4799926
- DOI: 10.1111/bcp.12851
Development of a pharmacokinetic-guided dose individualization strategy for hydroxyurea treatment in children with sickle cell anaemia
Abstract
Aims: Hydroxyurea has emerged as the primary disease-modifying therapy for patients with sickle cell anaemia (SCA). The laboratory and clinical benefits of hydroxyurea are optimal at maximum tolerated dose (MTD), but the current empirical dose escalation process often takes up to 12 months. The purpose of this study was to develop a pharmacokinetic-guided dosing strategy to reduce the time required to reach hydroxyurea MTD in children with SCA.
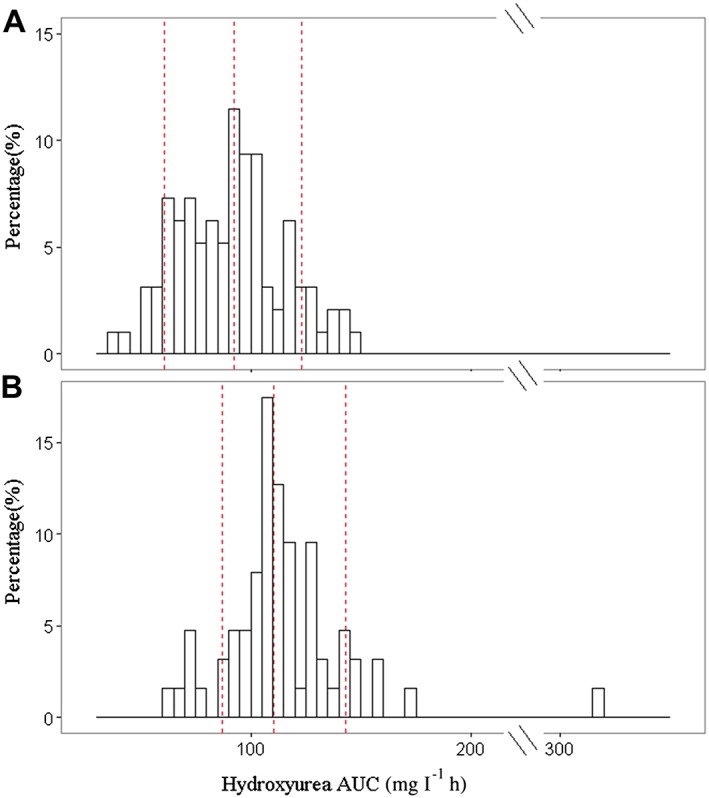
Methods: Pharmacokinetic (PK) data from the HUSTLE trial (NCT00305175) were used to develop a population PK model using non-linear mixed effects modelling (nonmem 7.2). A D-optimal sampling strategy was developed to estimate individual PK and hydroxyurea exposure (area under the concentration-time curve (AUC)). The initial AUC target was derived from HUSTLE clinical data and defined as the mean AUC at MTD.
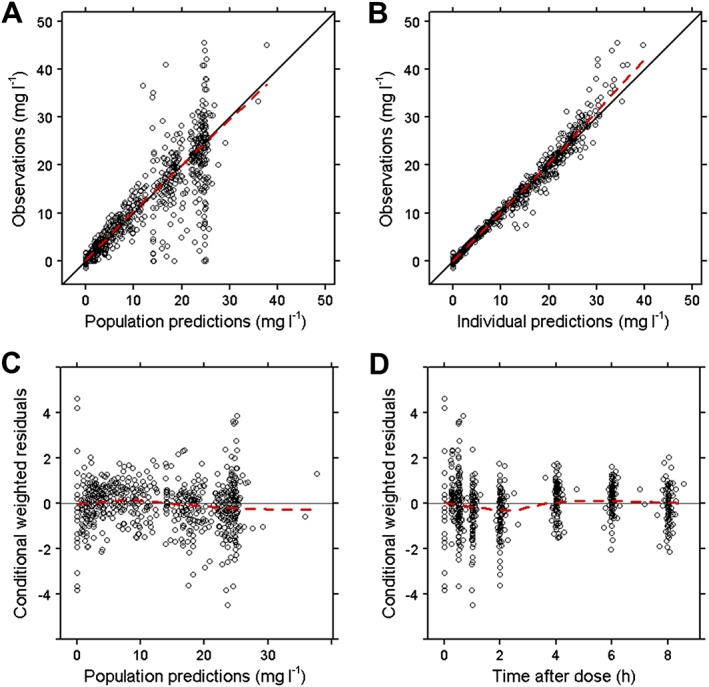
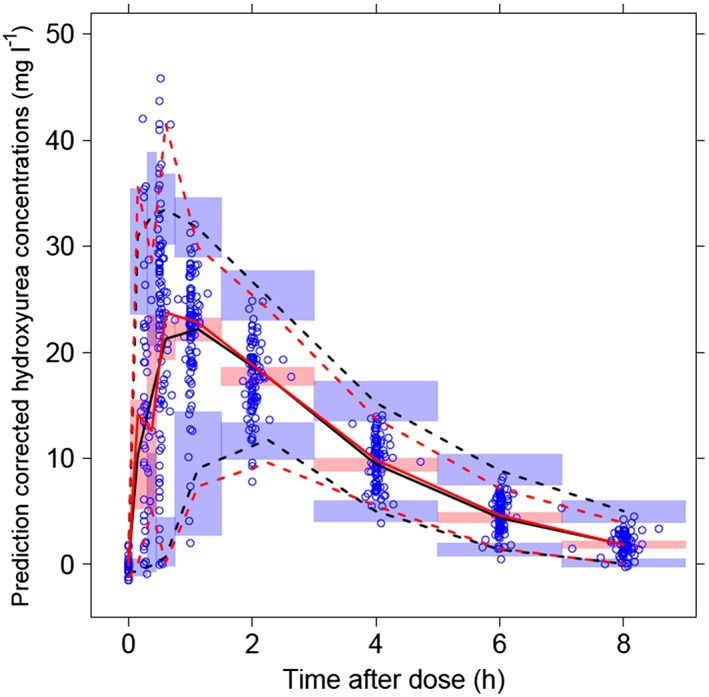
Results: PK profiles were best described by a one compartment with Michaelis-Menten elimination and a transit absorption model. Body weight and cystatin C were identified as significant predictors of hydroxyurea clearance. The following clinically feasible sampling times are included in a new prospective protocol: pre-dose (baseline), 15-20 min, 50-60 min and 3 h after an initial 20 mg kg(-1) oral dose. The mean target AUC(0,∞) for initial dose titration was 115 mg l(-1) h.
Conclusion: We developed a PK model-based individualized dosing strategy for the prospective Therapeutic Response Evaluation and Adherence Trial (TREAT, ClinicalTrials.gov NCT02286154). This approach has the potential to optimize the dose titration of hydroxyurea therapy for children with SCA, such that the clinical benefits at MTD are achieved more quickly.
Keywords: cystatin C; hydroxyurea (HU); individualized dosing; maximum tolerated dose (MTD); population pharmacokinetics; sickle cell anaemia (SCA).
© 2015 The British Pharmacological Society.
Figures
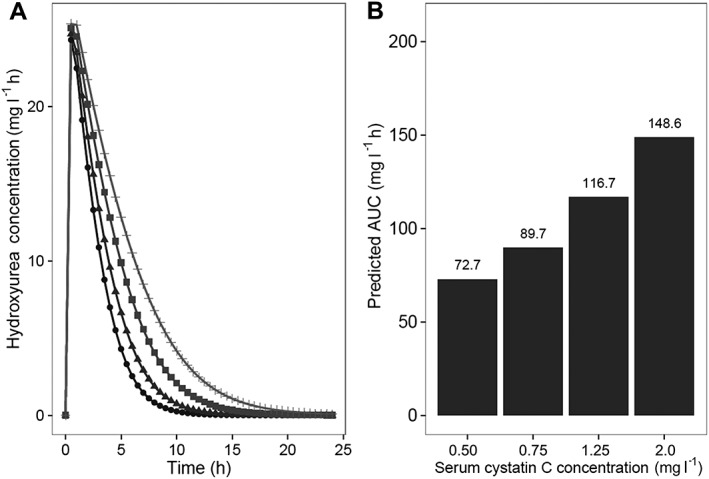
 , Cystatin C = 0.50 mg l−1;
  , Cystatin C = 0.75 mg l−1;
  , Cystatin C = 1.25 mg l−1;
  , Cystatin C = 2.0 mg l−1
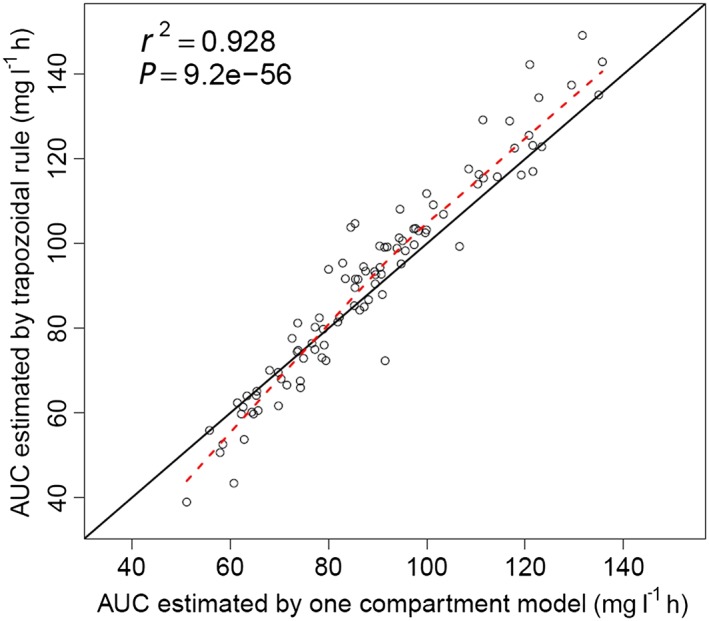
References
-
- Steinberg MH, McCarthy WF, Castro O, Ballas SK, Armstrong FD, Smith W, Ataga K, Swerdlow P, Kutlar A, DeCastro L, Waclawiw MA. Investigators of the Multicenter Study of Hydroxyurea in Sickle Cell A, Follow‐Up MSHP. The risks and benefits of long‐term use of hydroxyurea in sickle cell anemia: A 17.5 year follow‐up. Am J Hematol 2010; 85: 403–8. - PMC - PubMed
-
- Charache S, Terrin ML, Moore RD, Dover GJ, Barton FB, Eckert SV, McMahon RP, Bonds DR. Effect of hydroxyurea on the frequency of painful crises in sickle cell anemia. Investigators of the Multicenter Study of Hydroxyurea in Sickle Cell Anemia. N Engl J Med 1995; 332: 1317–22. - PubMed
-
- Voskaridou E, Christoulas D, Bilalis A, Plata E, Varvagiannis K, Stamatopoulos G, Sinopoulou K, Balassopoulou A, Loukopoulos D, Terpos E. The effect of prolonged administration of hydroxyurea on morbidity and mortality in adult patients with sickle cell syndromes: results of a 17‐year, single‐center trial (LaSHS). Blood 2010; 115: 2354–63. - PubMed
-
- Wang WC, Ware RE, Miller ST, Iyer RV, Casella JF, Minniti CP, Rana S, Thornburg CD, Rogers ZR, Kalpatthi RV, Barredo JC, Brown RC, Sarnaik SA, Howard TH, Wynn LW, Kutlar A, Armstrong FD, Files BA, Goldsmith JC, Waclawiw MA, Huang X, Thompson BW, Investigators BABYHUG. Hydroxycarbamide in very young children with sickle‐cell anaemia: a multicentre, randomised, controlled trial (BABY HUG). Lancet 2011; 377: 1663–72. - PMC - PubMed
Publication types
MeSH terms
Substances
Associated data
Grants and funding
LinkOut - more resources
Full Text Sources
Other Literature Sources
Medical
