. 2016 Jan:77:291-306.
doi: 10.1016/j.biomaterials.2015.11.021. Epub 2015 Nov 14.

DNA-gadolinium-gold nanoparticles for in vivo T1 MR imaging of transplanted human neural stem cells

Affiliations

DNA-gadolinium-gold nanoparticles for in vivo T1 MR imaging of transplanted human neural stem cells

Francesca J Nicholls et al. Biomaterials. 2016 Jan.

Abstract

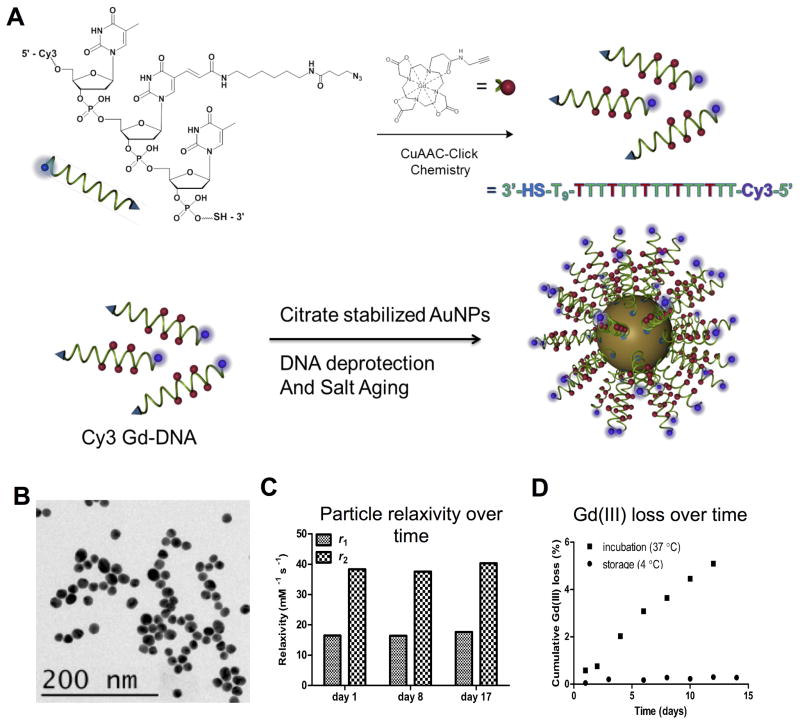
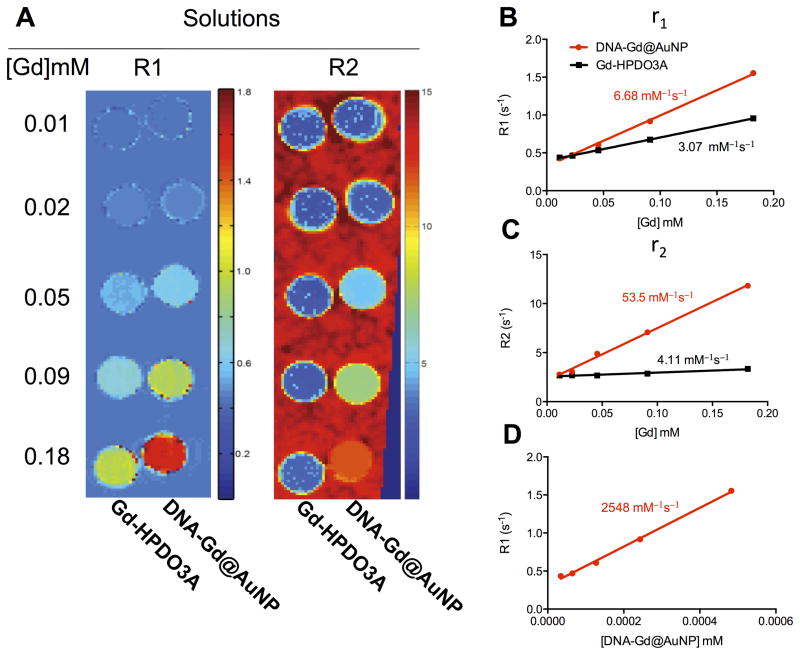
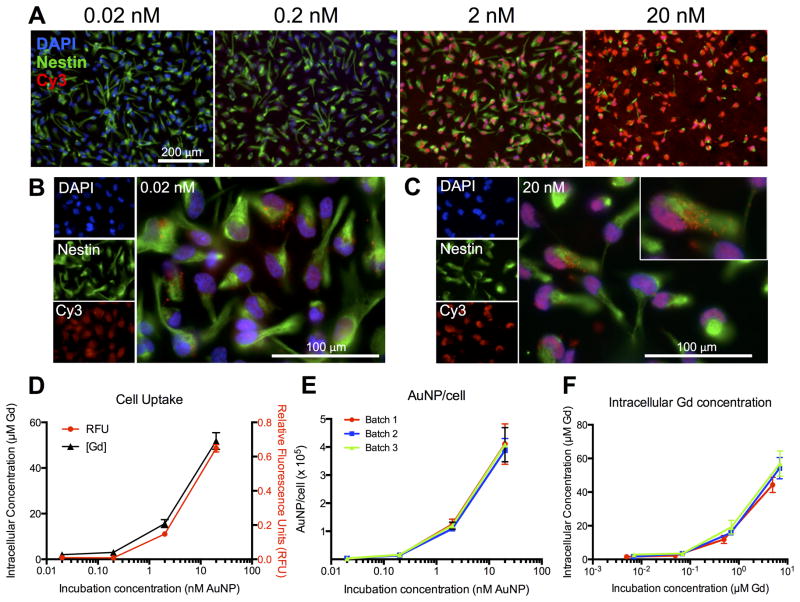
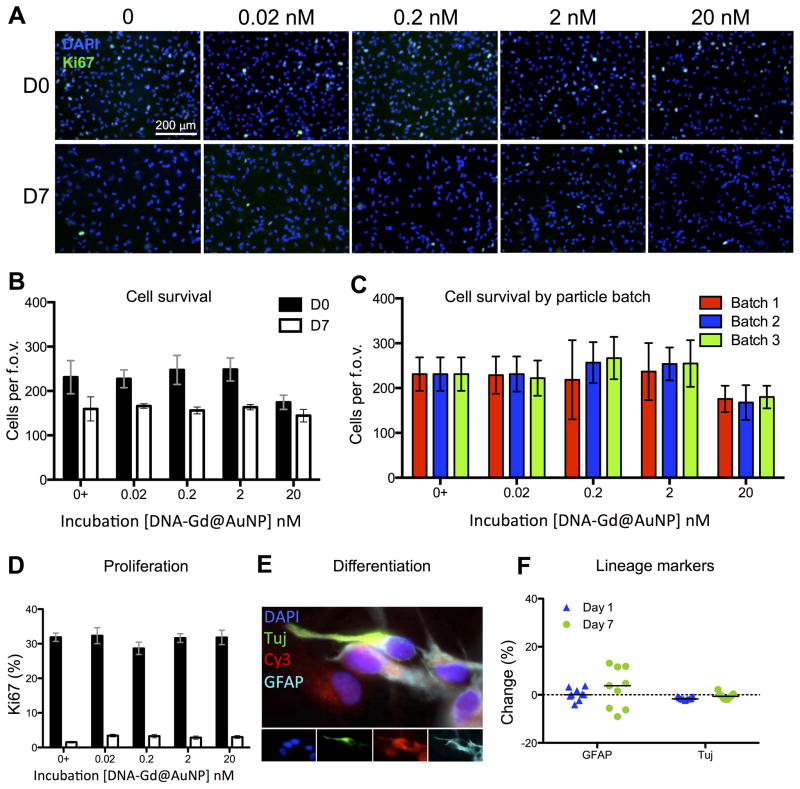
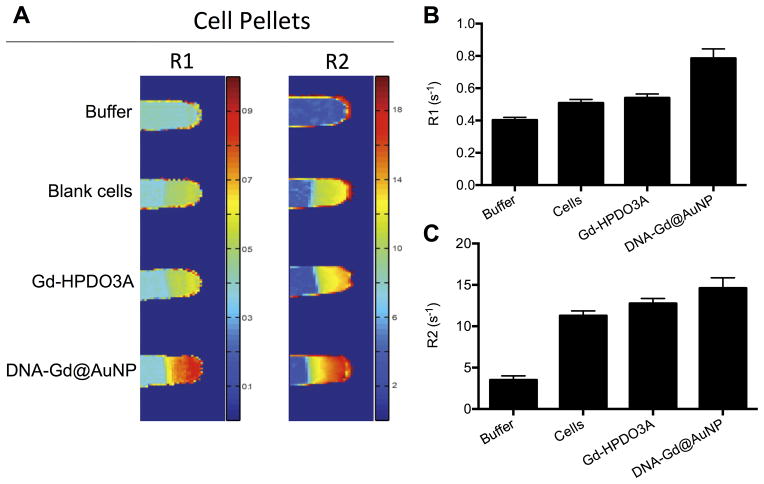
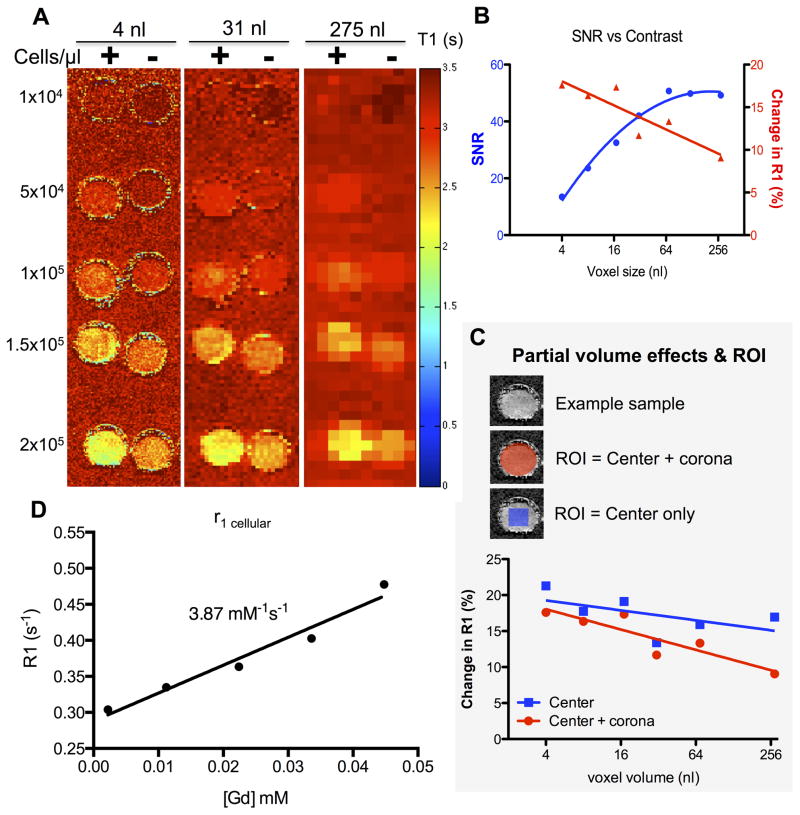
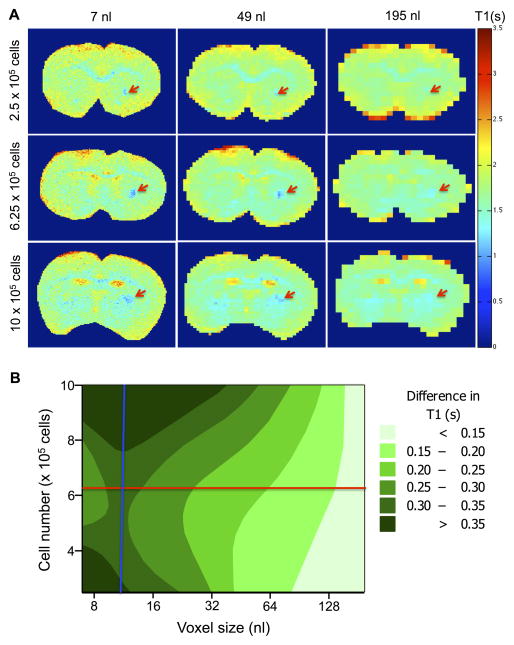
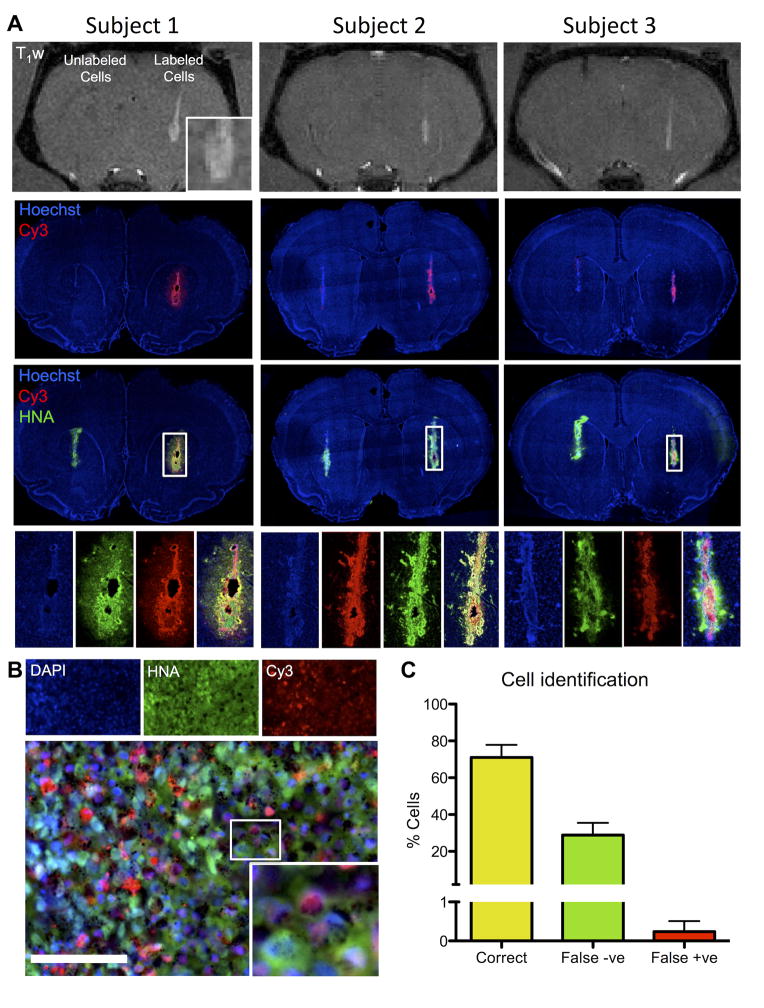
The unambiguous imaging of transplanted cells remains a major challenge to understand their biological function and therapeutic efficacy. In vivo imaging of implanted cells is reliant on tagging these to differentiate them from host tissue, such as the brain. We here characterize a gold nanoparticle conjugate that is functionalized with modified deoxythymidine oligonucleotides bearing Gd(III) chelates and a red fluorescent Cy3 moiety to visualize in vivo transplanted human neural stem cells. This DNA-Gd@Au nanoparticle (DNA-Gd@AuNP) exhibits an improved T1 relaxivity and excellent cell uptake. No significant effects of cell uptake have been found on essential cell functions. Although T1 relaxivity is attenuated within cells, it is sufficiently preserved to afford the in vivo detection of transplanted cells using an optimized voxel size. In vivo MR images were corroborated by a post-mortem histological verification of DNA-Gd@AuNPs in transplanted cells. With 70% of cells being correctly identified using the DNA-Gd-AuNPs indicates an overall reliable detection. Less than 1% of cells were false positive for DNA-Gd@AuNPs, but a significant number of 30% false negatives reveals a dramatic underestimation of transplanted cells using this approach. DNA-Gd@AuNPs therefore offer new opportunities to visualize transplanted cells unequivocally using T1 contrast and use cellular MRI as a tool to derive biologically relevant information that allows us to understand how the survival and location of implanted cells determines therapeutic efficacy.

Keywords: Cell transplantation; Contrast agent; Gadolinium; Gd-HPDO3A; Gold; MRI; Nanoparticles; Neural stem cells.


Figures

Figure 1
Figure 1. DNA-Gd@AuNP synthesis and stability
Particles consist of a gold nanoparticle core loaded with DNA to which the Gd-HPDO3A and Cy3 moieties are attached (A). Transmission electron microscopy (TEM) of conjugated DNA-Gd@Au nanoparticles for size determination (B). Particles retain their relaxivity properties at 1.41 T over more than 2 weeks (C). There is a small amount of Gd(III) loss at 37 °C, amounting to <6% of total Gd(III) over 2 weeks. However, loss is negligible (<0.4%) when particles are stored at 4 °C (D).
Figure 2
Figure 2. MR relaxivity of DNA-Gd@AuNP nanoparticles
R1 and R2 maps of DNA-Gd@AuNP and Gd-HPDO3A were generated at 9.4 T (A). DNA-Gd@AuNP was shown to have 2.2x the r1 molar relaxivity of Gd-HPDO3A (B) and 13x the r2 relaxivity (C). Expressing r1 relaxivity on a “per mole of particle” basis suggested that r1 was 830x higher in DNA-Gd@AuNP (D).
Figure 3
Figure 3. Intracellular uptake of DNA-Gd@AuNP nanoparticles
Cell Uptake of DNA-Gd@AuNPs at different concentrations is shown by the fluorescent Cy3 moiety (red, A, scale bar = 200 μm). Fluorescence was visible even at the lowest concentration (B, scale bar = 100 μm) and appeared to be localized to the cytoplasm (C). Cell uptake was measured by ICP-MS and RFU per cell, which followed very similar patterns (D). Comparing three separate batches showed that particle uptake was highly consistent between batches (E), but that the variability in Gd(III) loading resulted in variation in intracellular Gd(III) concentration (F).
Figure 4
Figure 4. Cellular effects of DNA-Gd@AuNPs
Cells at day 0 and day 7 after labeling were stained with DAPI and Ki67 (A, scale bar = 200 μm). No significant effects were seen on the number of surviving cells at any concentration of DNA-Gd@AuNPs at day 0 or day 7 (B) and this effect remained consistent when three separate batched of particles were tested (C). The percentage of cells expressing Ki67 also remained consistent at all DNA-Gd@AuNP concentrations at day 0 and day 7 (D). Cells were also stained to assess phenotypic changes (E), and no significant differences were seen between those labeled at 20 nM nanoparticles and controls (F).
Figure 5
Figure 5. In vitro imaging of cell pellets
Blank cells, and cells labeled either with Gd-HPDO3A or DNA-Gd@AuNP were imaged at 9.4 T to generate R1 and R2 maps (A). Cells labeled with DNA-Gd@AuNP increased relaxivity compared to unlabeled cells and those labeled with Gd-HPDO3A on both R1 (B) and R2 (C)
Figure 6
Figure 6. Effect of voxel size and ROI selection on cell detection in vitro
Labeled and unlabeled cells were suspended in 6% gelatin at different cell densities with T1 maps being generated (A, + = labeled cells, = blank cells). Increasing voxel size resulted in increased SNR, but less contrast between labeled and unlabeled cells (B). As voxel size increases, peripheral voxels are increasingly susceptible to partial volume effects that attenuate T1 contrast (C). If measurement of T1 is confined to the center of the ROI, there is little attenuation of T1 contrast across voxel sizes, hence abating the partial volume effects. However, measurement of cell distribution will depend on a reliable measurement of peripheral voxels as well as those at the core of the implantation site. The r1 relaxivity of DNA-Gd@AuNPs in cells is 3.87 mM−1s−1 (D), significantly lower than that in solution.
Figure 7
Figure 7. Effect of voxel size and cell number on ex vivo detection
T1 maps of 3 different injection sites were acquired at 6 different voxel sizes (A. Red arrows indicate implanted cells). The difference in T1 between labeled and unlabeled cells was compared across cell number and voxel volume, with voxel volume having a more marked effect than cell number. The conditions taken forward for in vivo image acquisition were 12 nL voxel volume (blue line) and 6.25×10⁵ cells (red line, B).
Figure 8
Figure 8. In vivo imaging with histological verification
Three animals were transplanted with labeled cells in one hemisphere and unlabeled cells in the other. DNA-Gd@AuNP labeled cells were clearly visible on T1-weighted (T1w) MR images (A). The deposit could be seen with some infiltration into the host tissue (inset for subject 1). In all animals with labeled cells, the injection tract was clearly visibile. In contrast, unlabeled cells did not produce a signal in the right hemisphere. Fluorescent histology corroborated these in vivo results indicating that in both hemispheres transplanted cells were present (human nuclei antigen, HNA, in green), but only cells containing DNA-Gd@AuNP nanoparticles (as detected by the red Cy3 moiety) produced a T1 effect on MR images. A higher magnification image shows good colocalisation of HNA and Cy3 (B, scale bar = 100 μm), which is supported by the quantification showing a high level of accurate cell identification with less than 1% of false positives, but a substantial number of false negatives (C).

References

    1. Smith EJ, Stroemer RP, Gorenkova N, Nakajima M, Crum WR, Tang E, et al. Implantation Site and Lesion Topology Determine Efficacy of a Human Neural Stem Cell Line in a Rat Model of Chronic Stroke. Stem Cells. 2011 - PubMed
    1. Naumova AV, Modo M, Moore A, Murry CE, Frank JA. Clinical imaging in regenerative medicine. Nat Biotechnol. 2014;32:804–18. - PMC - PubMed
    1. Nguyen PK, Riegler J, Wu JC. Stem cell imaging: from bench to bedside. Cell Stem Cell. 2014;14:431–44. - PMC - PubMed
    1. Modo M, Kolosnjaj-Tabi J, Nicholls F, Ling W, Wilhelm C, Debarge O, et al. Considerations for the clinical use of contrast agents for cellular MRI in regenerative medicine. Contrast Media Mol Imaging. 2013;8:439–55. - PubMed
    1. Shapiro EM, Skrtic S, Sharer K, Hill JM, Dunbar CE, Koretsky AP. MRI detection of single particles for cellular imaging. Proceedings of the National Academy of Sciences of the United States of America. 2004;101:10901–6. - PMC - PubMed

Publication types

MeSH terms