. 2015 Nov 30:5:17417.
doi: 10.1038/srep17417.

Drug target prioritization by perturbed gene expression and network information

Affiliations

Drug target prioritization by perturbed gene expression and network information

Zerrin Isik et al. Sci Rep. .

Abstract

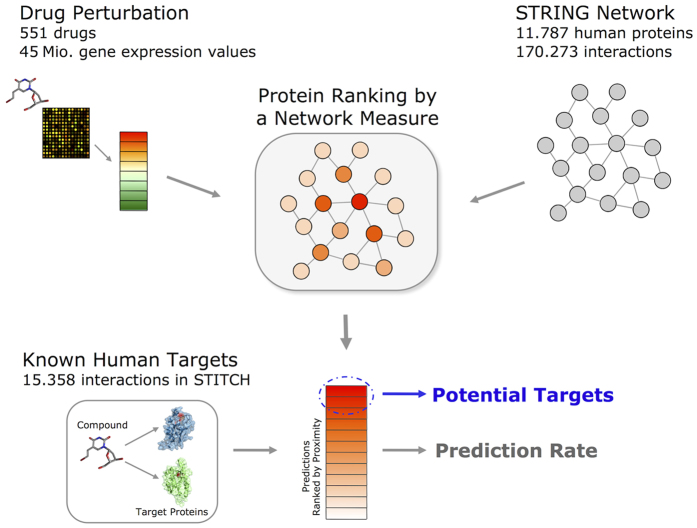
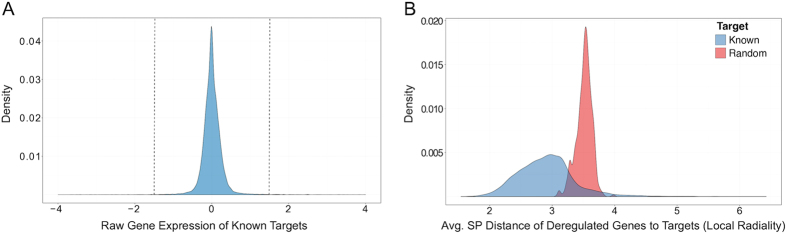
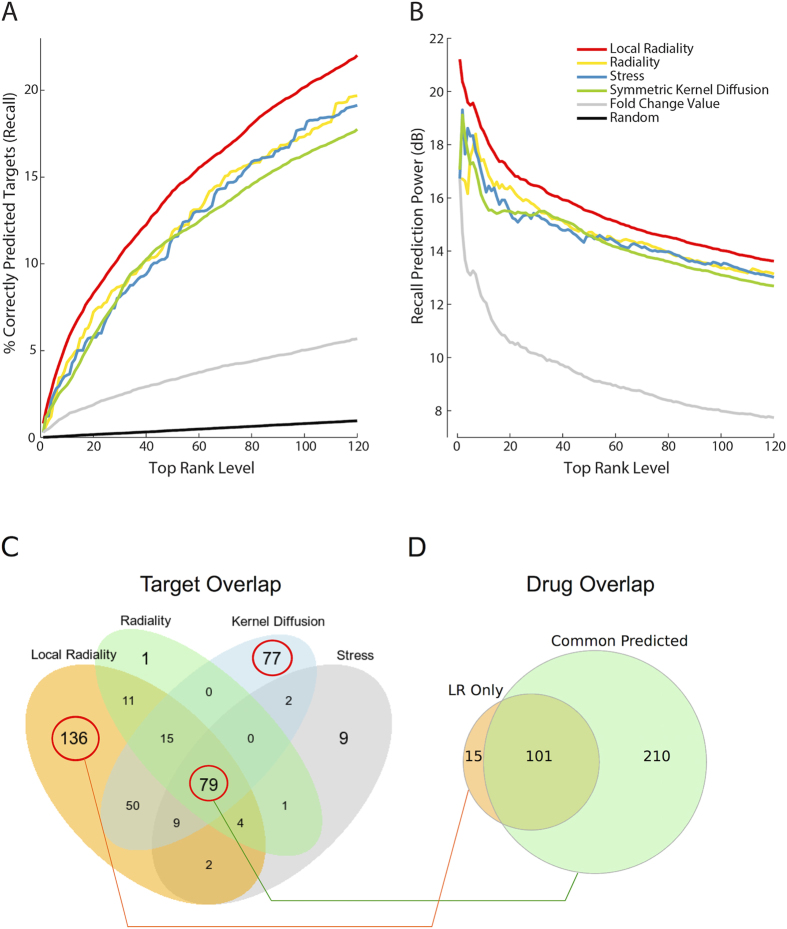
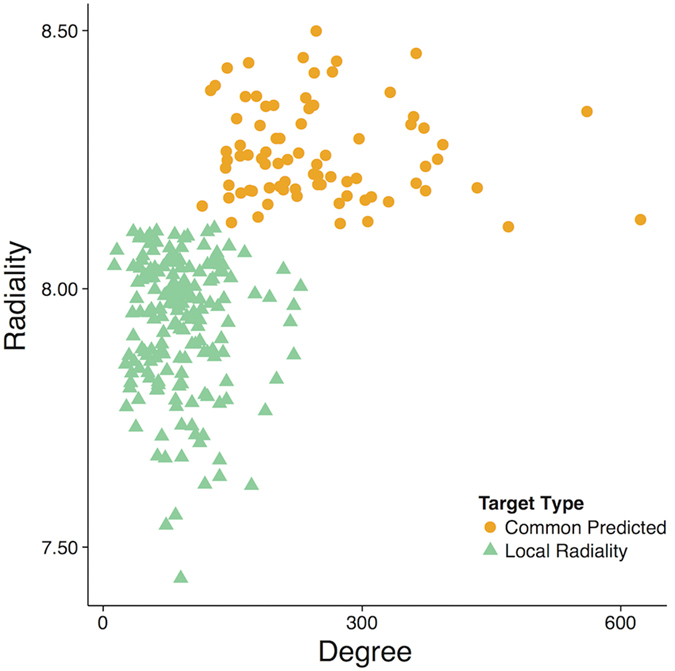
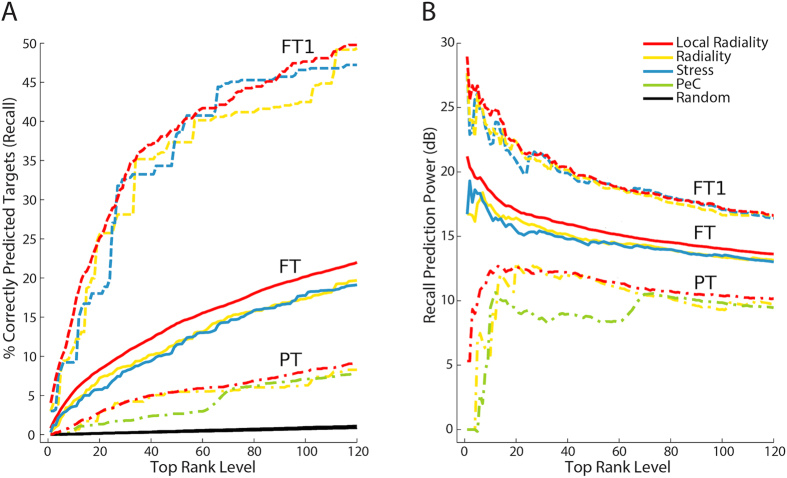
Drugs bind to their target proteins, which interact with downstream effectors and ultimately perturb the transcriptome of a cancer cell. These perturbations reveal information about their source, i.e., drugs' targets. Here, we investigate whether these perturbations and protein interaction networks can uncover drug targets and key pathways. We performed the first systematic analysis of over 500 drugs from the Connectivity Map. First, we show that the gene expression of drug targets is usually not significantly affected by the drug perturbation. Hence, expression changes after drug treatment on their own are not sufficient to identify drug targets. However, ranking of candidate drug targets by network topological measures prioritizes the targets. We introduce a novel measure, local radiality, which combines perturbed genes and functional interaction network information. The new measure outperforms other methods in target prioritization and proposes cancer-specific pathways from drugs to affected genes for the first time. Local radiality identifies more diverse targets with fewer neighbors and possibly less side effects.


Figures

Figure 1
Figure 1. Overview of the target prioritization method.
The perturbation of a drug on a specific tissue is measured by microarray experiments. Deregulated genes are obtained by comparison of drug-treated and control samples. A network measure computes a proximity score for each protein in the biological network based on its expression value, location to the deregulated genes or topological features. The proximity scores rank the possible drug targets, i.e., proteins with higher chance of being a target ranks on top of the sorted list. The target prioritization is evaluated by checking the rank of known drug targets (obtained from STITCH) in the sorted list of all proteins. The proteins listed in the high rank levels might be new potential targets.
Figure 2
Figure 2. The distributions of drug targets.
(A) Gene expression distribution of the 42331 known drug targets in the CMap. The significant targets reside on the right and left side of dashed lines. 97% of drug targets do not show significant expression changes due to drug perturbations. (B) The distribution of the average shortest path distances of deregulated genes to known (blue distribution) and to random (red distribution) targets. Two distributions are statistically different (Mann–Whitney, p-value < 2.2e−16). Deregulated genes are closer to known targets than any other proteins in the network. Thus, this motivates a network based target prediction.
Figure 3
Figure 3. Results for drug-target prioritization methods.
(A) Prediction performance of the selected measures for functional targets (FT). The y-axis shows the cumulative percentage of correctly predicted targets (i.e., recall) of all drugs in the CMap, the x-axis gives the predicted rank level. The predictions are given for the 1st percentile (top 120) of the ranking list. The LR achieved 22% recall value, which is the highest prediction rate. (B) The prediction power (expressed in decibel, dB) of each measure compared to the random predictor. It shows the magnitude of recall for each predictor normalized with respect to the random predictor. (C) The overlap of known targets that are predicted in the 1st percentile. 79 targets (common predicted) are predicted by all measures. Radiality and stress usually predict similar targets, however LR (136 unique targets) and kernel diffusion (77 unique targets) predict different ones. (D) The overlap of the drugs that bind to proteins found by only LR (LR Only) and all measures (Common Predicted). There were 331 different drugs that bind to 79 proteins, which are predicted by several measures. However, 15 drugs bind to specific proteins that are predicted only by LR. In other words, common targets are usually well-studied proteins, while the LR targets are more specific ones and have more potential for new drugs.
Figure 4
Figure 4. Topological characteristics of frequently predicted target classes: only LR (green triangles), common predicted (orange circles).
The average degree of the known targets identified exclusively by LR is 94. For the common predicted targets, it is significantly larger (σ = 248). Similarly, the average radiality of targets identified by LR is relatively small versus the common predicted ones. These facts indicate that LR detects the targets, which represent hubs in local network modules rather than in the entire network.
Figure 5
Figure 5. Results for different drug target data sets.
(A) Comparison of functional (FT, FT1) and physical (PT) targets for selected measures. The predictions are given only for the 1st percentile of the ranking list. Note that due to very close recall values, three random predictor curves are over plotted. The highest recall (50%) was obtained on the FT1 (limited functional targets). Half of the measures correctly predicted 15% to 22% of the FT (all functional targets). The recall values are between 5% and 9% for PT (physical targets). Although the performance of the measures is highly dependent on the target definition, LR achieved the highest recall values for all target definitions. (B) The prediction power (expressed in decibel, dB) of each measure compared to the random predictor. It shows the magnitude of recall for each predictor normalized with respect to the random predictor.
Figure 6
Figure 6. A sub-network of selected targets and deregulated genes.
Four drugs (methylprednisolone, nimesulide, prednicarbate, and simvastatin) and their differentially expressed genes are shown in different colors in the STRING network. A rectangle node shape represents a target protein, and circles indicate interconnecting genes. Differentially expressed genes (including possible targets) are colored in the color of the appropriate drug. Therefore, each colored sub-network might represent affected downstream pathways of the given drug. Thus, the view of target-affected genes community helps experimentalists design new drug experiments.
Figure 7
Figure 7. Downstream affected pathways for the Pioglitazone treatment.
(A) The shortest paths network. The colored nodes represent deregulated genes and bold circled nodes have specific Gene Ontology annotations (e.g., angiogenesis, apoptosis). (B) The core pathway affected by the activation of PPARG. The color indicates the gene expression value of the node. An edge represents an activation or inhibition between two genes.

References

    1. Lamb J. et al. The connectivity map: using gene-expression signatures to connect small molecules, genes, and disease. Science 313, 1929–35 (2006). - PubMed
    1. Iskar M. et al. Characterization of drug-induced transcriptional modules: towards drug repositioning and functional understanding. Mol Syst Biol 9, 662 (2013). - PMC - PubMed
    1. Csermely P., Korcsmáros T., Kiss H. J. M., London G. & Nussinov R. Structure and dynamics of molecular networks: A novel paradigm of drug discovery: A comprehensive review, Pharmacol Ther 138, 333–408 (2013). - PMC - PubMed
    1. Laenen G., Thorrez L., Bornigen D. & Moreau Y. Finding the targets of a drug by integration of gene expression data with a protein interaction network. Mol BioSyst 9, 1676–85 (2013). - PubMed
    1. Emig D. et al. Drug target prediction and repositioning using an integrated network-based approach. PLoS One 8, e60618 (2013). - PMC - PubMed

Publication types