. 2015 Nov 30:5:17434.
doi: 10.1038/srep17434.

Genome-wide expression analysis offers new insights into the origin and evolution of Physcomitrella patens stress response

Affiliations

Genome-wide expression analysis offers new insights into the origin and evolution of Physcomitrella patens stress response

Basel Khraiwesh et al. Sci Rep. .

Abstract

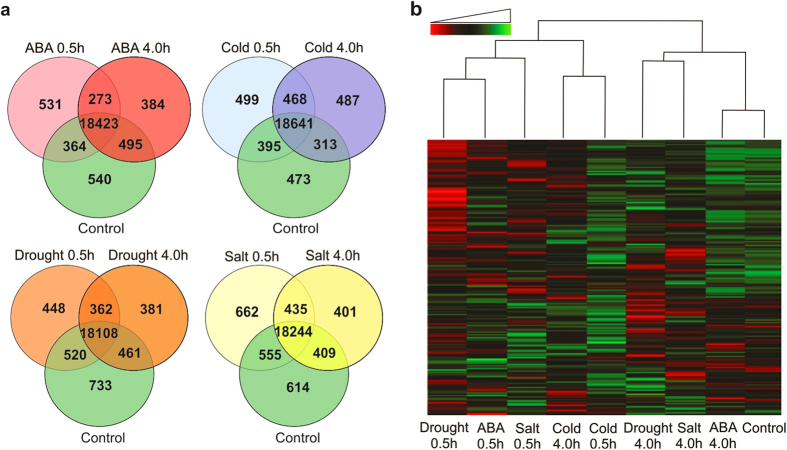
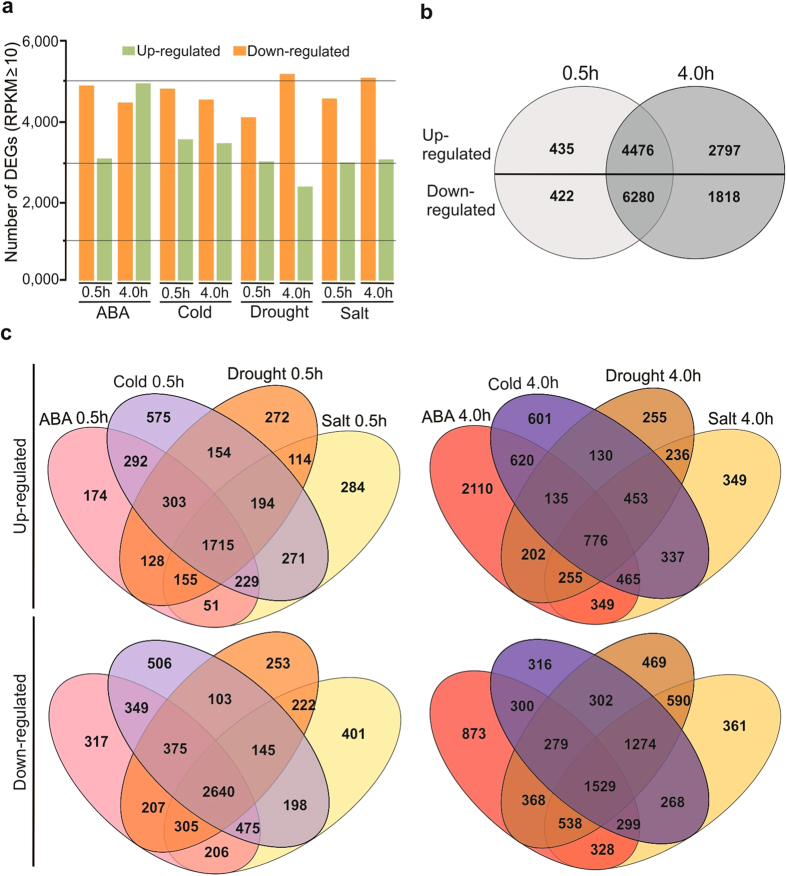
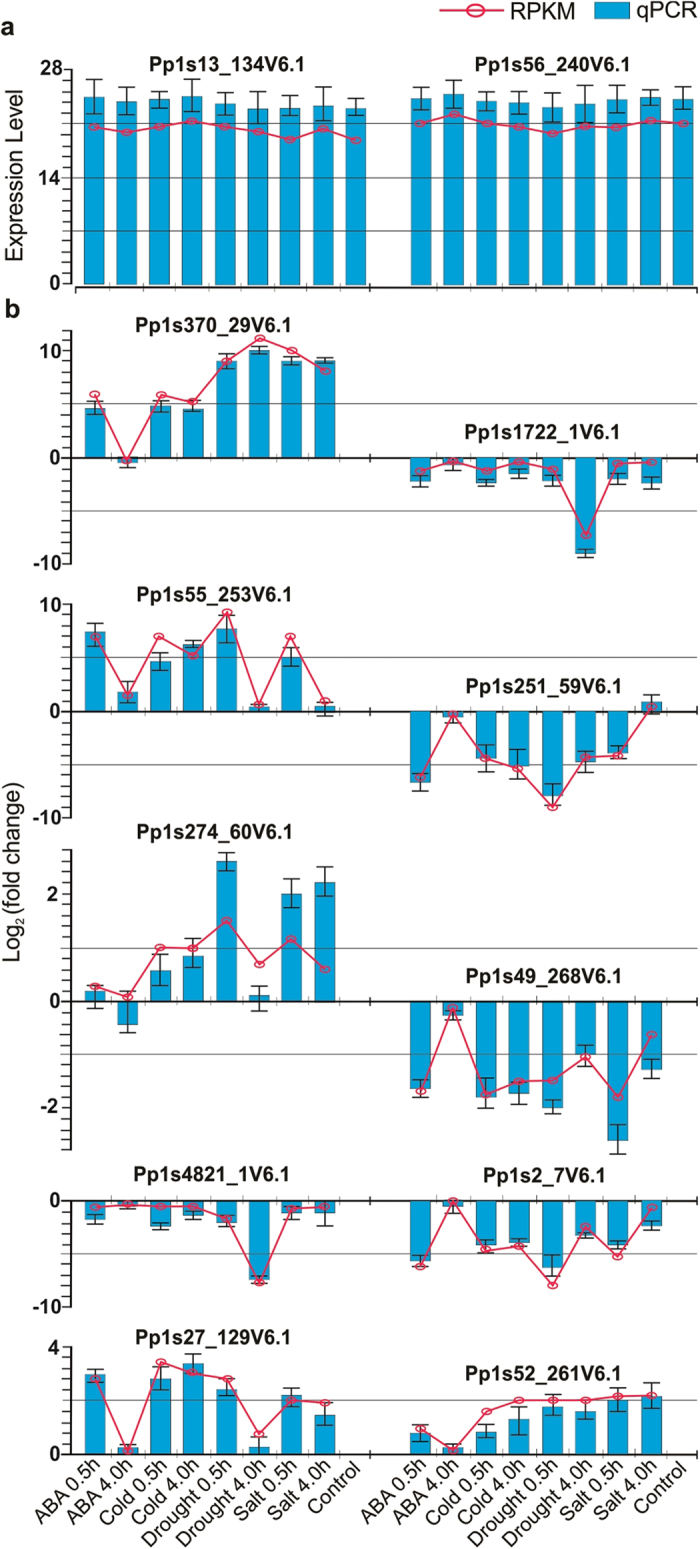
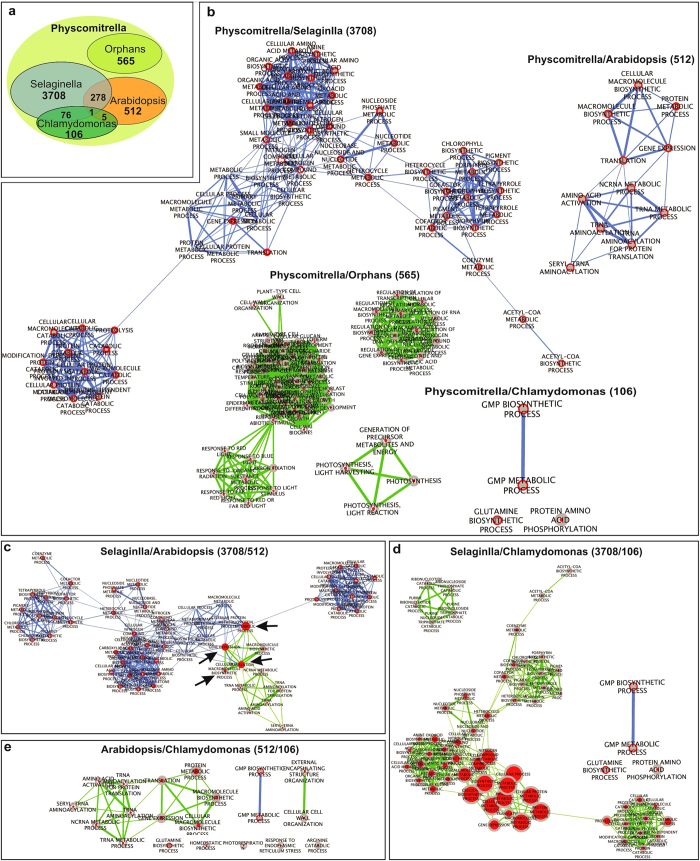
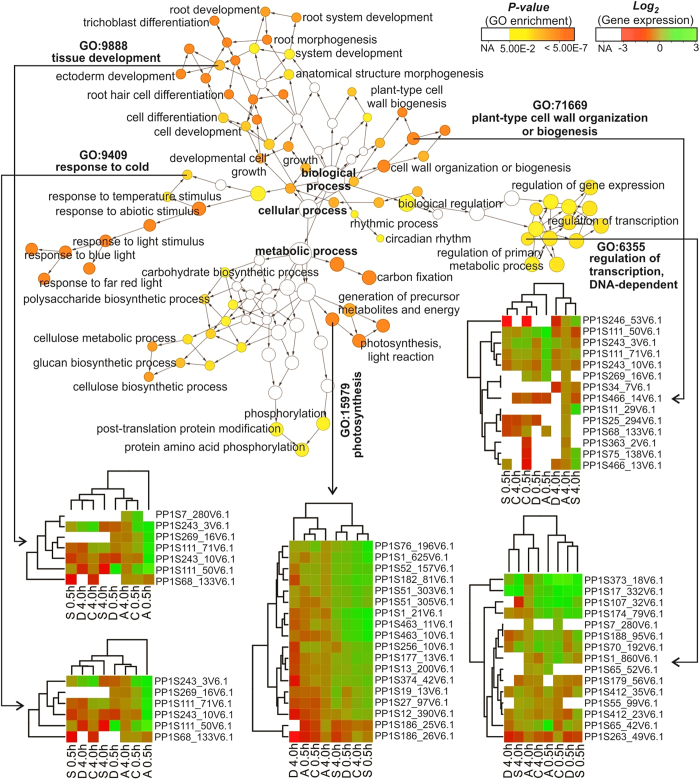
Changes in the environment, such as those caused by climate change, can exert stress on plant growth, diversity and ultimately global food security. Thus, focused efforts to fully understand plant response to stress are urgently needed in order to develop strategies to cope with the effects of climate change. Because Physcomitrella patens holds a key evolutionary position bridging the gap between green algae and higher plants, and because it exhibits a well-developed stress tolerance, it is an excellent model for such exploration. Here, we have used Physcomitrella patens to study genome-wide responses to abiotic stress through transcriptomic analysis by a high-throughput sequencing platform. We report a comprehensive analysis of transcriptome dynamics, defining profiles of elicited gene regulation responses to abiotic stress-associated hormone Abscisic Acid (ABA), cold, drought, and salt treatments. We identified more than 20,000 genes expressed under each aforementioned stress treatments, of which 9,668 display differential expression in response to stress. The comparison of Physcomitrella patens stress regulated genes with unicellular algae, vascular and flowering plants revealed genomic delineation concomitant with the evolutionary movement to land, including a general gene family complexity and loss of genes associated with different functional groups.


Figures

Figure 1
Figure 1. Global analysis of P. patens genes expression in response to abiotic stresses.
A comparison of commonly and uniquely expressed genes across the treatments was done using the obtained RPKM values. The comparison was done for control versus all stress treatments including the indicated two time points. (a) Venn diagrams showing overlap of expressed genes relative to control among different subgroups of P. patens abiotic stress treatments. (b) Hierarchical clustering analysis and heatmap of gene expression based on log2 ratio RPKM data across abiotic stress treatments and the control sample. Red color represents lower expression, green color represents higher expression (the expression range from −5.644 to 12.889). The heatmap is based on the distance function 1, correlation between each test statistic of the expression of each gene, columns represent individual experiments, and rows represent transcriptional units. The dendrogram at the top indicates clusters of individual treatments.
Figure 2
Figure 2. Differential expression of P. patens genes in response to abiotic stresses.
Differentially Expressed Genes (DEGs) were identified relative to the control sample grown under standard conditions. The differences in gene expression among the abiotic stress treatments and the control sample were obtained based on the RPKM-derived read count using a Log2 Ratio calculation. (a) Number of up regulated (green bars) and down regulated (orange bars) genes are shown for each stress treatment at the time point in hours. (b) Venn diagram showing overlap of DEGs among the two time points (0.5 and 4.0 h). (c) Venn diagrams showing overlap of DEGs in response to the four assayed abiotic stresses at two time points (0.5 and 4.0 h). Upper diagrams indicate up regulated genes and lower ones indicate down regulated genes. The numbers of genes in each region of the diagrams are indicated. The Venn diagrams depict the overlaps between each pairwise comparison.
Figure 3
Figure 3. Heatmaps of gene set enrichment analysis (GSEA) of DEGs based on RNAseq data in response to abiotic stresses.
GO annotation from P. patens genome annotation (v1.6) was analyzed with Blast2GO using the default parameters. The g:Profiler tool was used to classify the GSEA of P. patens stressed-DEGs for each condition based on up- and down-regulation status of the genes. (a) Selected functional groups for up regulated genes. (b) Selected functional groups for down regulated genes. The color intensities indicate the level of enrichment score of each GO term. Enrichments score is log10 (gene number). See Supplementary Datasets 15 and16 for the complete lists.
Figure 4
Figure 4. The early stress responses genes.
Expression patterns of early ABA- and stress-responsive gene in P. patens, only genes with high fold change were considered. (a,b) Heatmaps comparison of gene expression among 0.5 h stress treatments with high fold change. Columns represent individual treatments, and rows represent transcriptional units. (a) Up regulated genes (b) Down regulated genes. (c), Group of early stress-expressed genes, they are in the same manner at low and high expression value.
Figure 5
Figure 5. Validation of P. patens gene expression patterns in response to abiotic stresses.
Selected expression gene profiles were validated with quantitative real-time PCR (qPCR). (a) qPCR validation and expression analysis of Pp1s13_134V6.1 and Pp1s56_240V6.1, which they were used as reference genes. (b) qPCR validation and expression analysis of 10 DEGs (up and down) under different stress conditions and they were encode different functions. Blue bars indicate the expression level and Log2 (fold changes) obtained from qPCR for the three replicates. Red lines indicate the expression level and Log2 (fold change) from RNAseq data analyses. Error bars represent the standard error of the mean.
Figure 6
Figure 6. Evolutionary dynamics and orphan transcripts of DEGs.
(a) Venn diagram showing overlap of P. patens DEGs between C. reinhardtii, S. moellendorffii and A. thaliana based on BLAST-P analysis as well as the P. patens orphan DEGs. (b) Differentiating the GO enriched functional categories of P. patens orphan DEGs with P. patens/C. reinhardtii, P. patens/S. moellendorffii, and P. patens/A. thaliana genes (green represents the orphans and blue represents the genes conserved with other model organisms). (c) Comparative analysis between GO enriched functional categories of P. patens/S. moellendorffii and P. patens/A. thaliana groups (green represents the P. patens/A. thaliana enriched functional groups and blue represents the P. patens/S. moellendorffii enriched functional groups, arrows indicate the shared and connected GO enriched functional categories between the two groups). (d) Comparative analysis between GO enriched functional categories of P. patens/C. reinhardtii, and P. patens/S. moellendorffii groups (green represents the P. patens/S. moellendorffii enriched functional groups and blue represents the P. patens/C. reinhardtii enriched functional groups). (e) Comparative analysis between GO enriched functional categories of P. patens/C. reinhardtii, and P. patens/A. thaliana groups (green represents the P. patens/A. thaliana enriched functional groups and blue represents the P. patens/C. reinhardtii enriched functional groups). Cytoscape and Enrichment Map was used for visualization of the GSEA results from BiNGO plug-in. Node size represent the number of genes in P. patens. The color varies based on the BiNGO p-value significance. Edge size reflects the number of overlapping genes between the two connected gene-sets.
Figure 7
Figure 7. A network of GO categories combined with representative heatmaps for P. patens orphan stressed-DEGs.
BiNGO, a cytoscape plugin was used to visualize the GO terms that were statistically (hypergeometric test) over-represented from the P. patens orphan DEGs. Representative heatmaps clustering analysis of gene expression based on RPKM log2 ratio. The color scale (from white, yellow to dark orange) is based on (corrected) p-value (5% FDR, p = 0.05). Dark orange categories are most significantly overrepresented, white nodes are not significantly overrepresented (NA); they are included to show other nodes in the context of the GO hierarchy. The area of a node is proportional to the number of genes in the test set annotated to the corresponding GO category. The heatmaps were generated using the R gplots package. The RPKMs were used as input for the hierarchical clustering using Euclidean measure to obtain distance matrix, complete agglomeration and dendograms. The color scale (from white, red to green) is based on log2 fold change. Green represents the up-regulated genes; red represent the down-regulated ones among the different stress treatments. White color indicated no gene expression in certain stress treatment (NA), A: ABA, C: cold: D: drought, S: salt.

References

    1. Rensing S. A. et al. The Physcomitrella genome reveals evolutionary insights into the conquest of land by plants. Science 319, 64–69 (2008). - PubMed
    1. Zimmer A. D. et al. Reannotation and extended community resources for the genome of the non-seed plant Physcomitrella patens provide insights into the evolution of plant gene structures and functions. BMC genomics 14, 498 (2013). - PMC - PubMed
    1. Floyd S. K. & Bowman J. L. The ancestral developmental tool kit of land plants. Int J Plant Sci 168, 1–35 (2007).
    1. Khraiwesh B. & Qudeimat E. in Climate change and plant abiotic Stress Tolerance 481-506 (Wiley-VCH Verlag GmbH & Co. KGaA, 2013).
    1. Knight H. & Knight M. R. Abiotic stress signalling pathways: specificity and cross-talk. Trends in plant science 6, 262–267 (2001). - PubMed

Publication types