Review
. 2016 Feb;15(1):4-13.
doi: 10.1111/acel.12424. Epub 2015 Nov 29.

Using measures of single-cell physiology and physiological state to understand organismic aging

Affiliations
Review

Using measures of single-cell physiology and physiological state to understand organismic aging

Alexander Mendenhall et al. Aging Cell. 2016 Feb.

Abstract

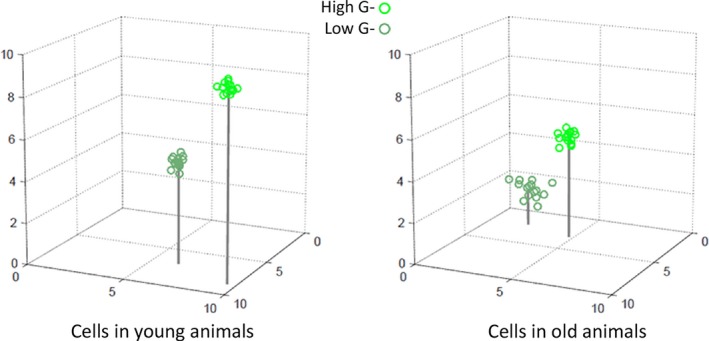
Genetically identical organisms in homogeneous environments have different lifespans and healthspans. These differences are often attributed to stochastic events, such as mutations and 'epimutations', changes in DNA methylation and chromatin that change gene function and expression. But work in the last 10 years has revealed differences in lifespan- and health-related phenotypes that are not caused by lasting changes in DNA or identified by modifications to DNA or chromatin. This work has demonstrated persistent differences in single-cell and whole-organism physiological states operationally defined by values of reporter gene signals in living cells. While some single-cell states, for example, responses to oxygen deprivation, were defined previously, others, such as a generally heightened ability to make proteins, were, revealed by direct experiment only recently, and are not well understood. Here, we review technical progress that promises to greatly increase the number of these measurable single-cell physiological variables and measureable states. We discuss concepts that facilitate use of single-cell measurements to provide insight into physiological states and state transitions. We assert that researchers will use this information to relate cell level physiological readouts to whole-organism outcomes, to stratify aging populations into groups based on different physiologies, to define biomarkers predictive of outcomes, and to shed light on the molecular processes that bring about different individual physiologies. For these reasons, quantitative study of single-cell physiological variables and state transitions should provide a valuable complement to genetic and molecular explanations of how organisms age.

Keywords: aging; chance; physiology; quantitative microscopy; reporter genes; single-cell; stochastic.


Figures

Figure 1
Figure 1
States and trajectories in physiological state space. Hypothetical plot shows values of three physiological variables measured in different individuals at different times. Measurements define clusters of points close in Euclidean distance in this space, here denoted by colored circles. Identification of such clusters is a quantitative means allowing researchers to define, operationally, qualitatively distinct physiological states. In the example here, the different colors correspond to states qualitatively used to describe health and sickness, and arrows indicate transitions between different states observed in different individuals. Values of variables from a given individual over time define a trajectory in this space.
Figure 2
Figure 2
Quantification of a single‐cell physiological variable, G, in Saccharomyces cerevisiae. Top Panel. A cell containing two reporter genes after (Colman‐Lerner et al., 2005). Signaling System 1 activates Promoter 1, P1, which directs synthesis of a cyan fluorescent protein. An unrelated system, Signaling System 2, activates an unrelated promoter, Promoter 2, which directs the synthesis of yellow fluorescent protein. Bottom Panel. Correlated output of the reporter genes in a population of isogenic single cells (Colman‐Lerner et al., 2005). Each dot shows YFP and CFP signal from a single cell, quantified by careful light microscopy (Gordon et al., 2007; Bush et al., 2012). Gray arrow shows correlation line. Correlated variation defines a new single‐cell physiological variable, G, a measure of the general ability of each cell to express genes into proteins. Cells with higher correlated expression have higher G. Red circles show two cells, one with low G, one with high G. Cell states defined by this variable persist over many hours. Consequences of a high G state include heightened expression of all measured genes, and a more rapid increase in cell volume (Colman‐Lerner et al., 2005).
Figure 3
Figure 3
Interindividual differences in gene expression in isogenic populations of C. elegans and differences in lifespan predicted by differences in gene expression. Data replotted from (Mendenhall et al., 2012). Left Panel. Distribution of values of reporter expression among animals in the population. Vertical bars show brightest and dimmest 10% of animals. Right Panel. Animals in the highest range of values for gene expression (solid bright green line) live longer than those in the lowest range (dashed darker green line). Therefore, in this example, both high and low ranges of values of the physiological variable, P hsp‐16.2 GFP‐signal, operationally define distinct and consequential whole‐organism physiological states.
Figure 4
Figure 4
Single‐cell trajectories through physiological state space defined by changes in the values of reporter gene expression. (A) Layout of intestine cells in the adult worm, showing cells int4V and int4D. (B) Induced expression of P hsp‐17 ::gfp and P hsp‐16.2 ::mCherry reporters in cells int4V and int4D in control animals and animals treated with an acute stimulus (ethanol exposure). (C) Trajectories of measured int4V and int4D cells from control‐ and ethanol‐exposed animals 16 h after 30 min 7% ethanol exposure, plotted in a three‐dimensional state space whose axes correspond to expression of the P hsp‐17 and P hsp‐16.2 reporters and P vit‐2 reporters.
Figure 5
Figure 5
Hypothetical single‐cell trajectories in a three‐dimensional state space during aging. Figure shows values for three physiological variables in a particular cell in young and old Caenorhabditis elegans. Young animals and old animals are in two groups collected by sorting as in Fig. 3: long‐lived, bright, high G and short‐lived, dim, low G. In this example, values for all three variables were lower in older animals. Moreover, cell‐to‐cell variation in the measured variables was higher in older animals, with the highest variation in the dim, low G group. In practice, future experiments will likely measure more than three variables per cell and statements about the trajectories defined by changes in values will be based not on inspection of plots but on computed changes in position in the appropriate high‐dimensional space.

References

    1. An G, Nieman G, Vodovotz Y (2012) Toward computational identification of multiscale “tipping points” in acute inflammation and multiple organ failure. Ann. Biomed. Eng. 40, 2414–2424. - PubMed
    1. Arden NK, Spector TD (1997) Genetic influences on muscle strength, lean body mass, and bone mineral density: a twin study. J. Bone Miner. Res. 12, 2076–2081. - PubMed
    1. Bahar R, Hartmann CH, Rodriguez KA, Denny AD, Busuttil RA, Dolle ME, Calder RB, Chisholm GB, Pollock BH, Klein CA, Vijg J (2006) Increased cell‐to‐cell variation in gene expression in ageing mouse heart. Nature 441, 1011–1014. - PubMed
    1. Baker GT III, Sprott RL (1988) Biomarkers of aging. Exp. Gerontol. 23, 223–239. - PubMed
    1. Baltanas R, Bush A, Couto A, Durrieu L, Hohmann S, Colman‐Lerner A (2013) Pheromone‐induced morphogenesis improves osmoadaptation capacity by activating the HOG MAPK pathway. Sci. Signal. 6, ra26. - PMC - PubMed

Publication types

LinkOut - more resources