Review
. 2015 Dec;25(12):769-779.
doi: 10.1016/j.tcb.2015.08.009.

Regulation of Microtubule Growth and Catastrophe: Unifying Theory and Experiment

Affiliations
Review

Regulation of Microtubule Growth and Catastrophe: Unifying Theory and Experiment

Hugo Bowne-Anderson et al. Trends Cell Biol. 2015 Dec.

Abstract

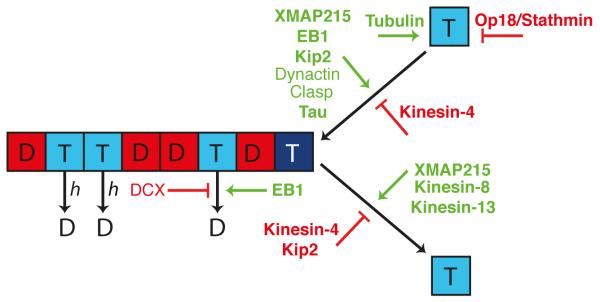
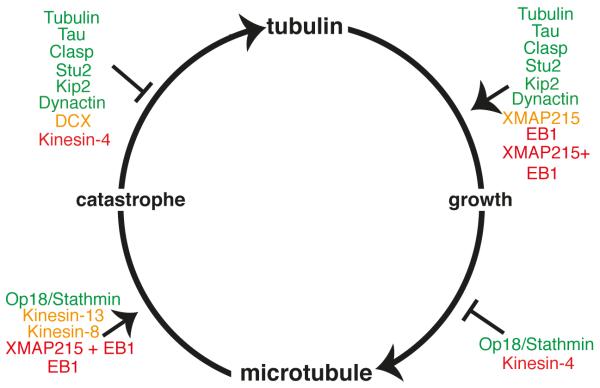
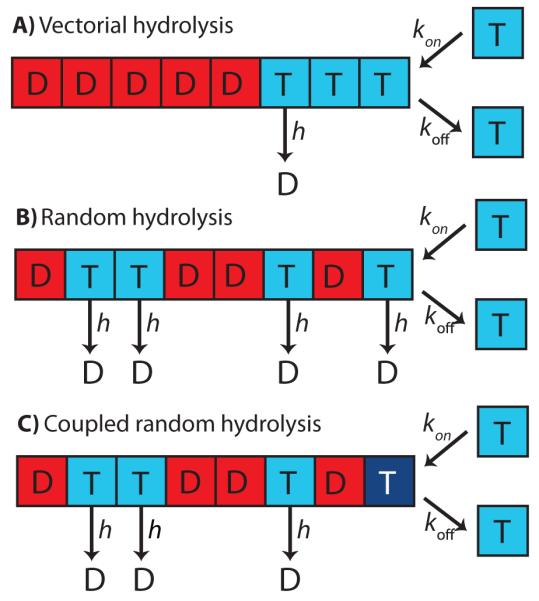
Recent studies have found that microtubule-associated proteins (MAPs) can regulate the dynamical properties of microtubules in unexpected ways. For most MAPs, there is an inverse relationship between their effects on the speed of growth and the frequency of catastrophe, the conversion of a growing microtubule to a shrinking one. Such a negative correlation is predicted by the standard GTP-cap model, which posits that catastrophe is due to loss of a stabilizing cap of GTP-tubulin at the end of a growing microtubule. However, many other MAPs, notably Kinesin-4 and combinations of EB1 with XMAP215, contradict this general rule. In this review, we show that a more nuanced, but still simple, GTP-cap model, can account for the diverse regulatory activities of MAPs.


Figures

Figure 1
Figure 1. Microtubules in cells and their GTP-hydrolysis cycle
A Microtubules (in blue) are dynamic polymers that form a radial cytoskeleton (left), a bipolar mitotic spindle (center) and the linear axoneme of cilia (right). B Tubulin is a GTPase. The predominant tubulin species in solution has GTP bound to the β-subunit. Hydrolysis of GTP by the dimer in solution is slow. Hydrolysis is accelerated by incorporation of the GTP-dimer into the microtubule lattice. To enter the lattice, the GTP-dimer first associates transiently with the end before becoming strongly bound; the dissociation of the strongly bound GTP-dimer is slow and its hydrolysis occurs with a delay, resulting in a cap of GTP-tubulin at the end. The cap stabilizes the microtubule against depolymerization. If the cap is lost and GDP-tubulin is exposed at the end, depolymerization is rapid, thereby completing the hydrolysis cycle. Microtubule-associated proteins (MAPs) up- and down-regulate all steps in this pathway, thereby allowing cells exquisite control of their microtubule cytoskeleton.
Figure 2
Figure 2. Regulation of microtubule growth and catastrophe by MAPs
Dynamic microtubules primarily exist in two distinct states: slowly growing and rapidly shrinking. Catastrophe is the transition from growth to shrinkage. In this Figure, we schematize the effects of a plethora of MAPs on the growth speed (vg) and catastrophe frequency (fcat). On the top right are those that increase the microtubule growth rate vg, on the bottom right those that decrease vg, on the bottom left those that increase catastrophe frequency fcat and on the top left those that decrease fcat. The MAPs in green accord with the standard GTP-cap model because they either (a) increase vg and decrease fcat or (b) decrease vg and increase fcat. The MAPs in red (e.g. EB1 + XMAP215, Kinesin-4) contradict the model as they either increase both fcat and vg or they decrease them both. MAPs in orange affect either vg or fcat and not the other.
Figure 3
Figure 3. The effects of MAPs on the key molecular parameters governing microtubule dynamics
In this schematic of coupled-random hydrolysis, the effects of a variety of MAPs on the molecular rate constants controlling microtubule dynamics are visualized. A MAP in green indicates that it accelerates the step (for example, EB1 increases both the hydrolysis rate constant h and the tubulin association rate constant kon); a MAP in red indicates that it slows the step (Kinesin-4 and Kip2, for example, decrease tubulin dissociation rate constant koff).
Box Figure I
Box Figure I. Models of microtubule growth and catastrophe
A, B and C are schematics of vectorial, random and coupled-random hydrolysis mechanisms respectively, visualized in the single protofilament case for simplicity. In all cases, GTP-tubulin tubulin dimers (T) associate stably with the microtubule end with rate constant kon per protofilament. koff is the rate at which the strongly bound GTP-dimers dissociate from the protofilaments end. In A, hydrolysis (conversion to GDP-tubulin, visualized as D) occurs with rate constant h and can only occur at the GDP-GTP interface: this implies that there is a hydrolysis front. In B, random hydrolysis occurs with rate constant h for any tubulin dimer in the tubulin lattice. In C, coupled-random hydrolysis occurs with rate constant h for any tubulin dimer in the tubulin lattice except for the dimer at the tip (and thus hydrolysis is coupled to microtubule growth). For more details, see [68], from which the Figure was redrawn.

References

    1. Hirokawa N, Tanaka Y. Kinesin superfamily proteins (KIFs): Various functions and their relevance for important phenomena in life and diseases. Exp. Cell Res. 2015 DOI: 10.1016/j.yexcr.2015.02.016. - PubMed
    1. Wang Z-X, et al. Axonal transport defects in Alzheimer’s disease. Mol. Neurobiol. 2015;51:1309–1321. - PubMed
    1. De Vos KJ, et al. Role of Axonal Transport in Neurodegenerative Diseases*. Annu. Rev. Neurosci. 2008;31:151–173. - PubMed
    1. Desai a, Mitchison TJ. Microtubule polymerization dynamics. Annu. Rev. Cell Dev. Biol. 1997;13:83–117. - PubMed
    1. Goodwin SS, Vale RD. Patronin Regulates the Microtubule Network by Protecting Microtubule Minus Ends. Cell. 2010;143:263–274. - PMC - PubMed

Publication types

Substances