. 2015 Nov 30:6:10069.
doi: 10.1038/ncomms10069.

Capture Hi-C reveals novel candidate genes and complex long-range interactions with related autoimmune risk loci

Affiliations

Capture Hi-C reveals novel candidate genes and complex long-range interactions with related autoimmune risk loci

Paul Martin et al. Nat Commun. .

Abstract

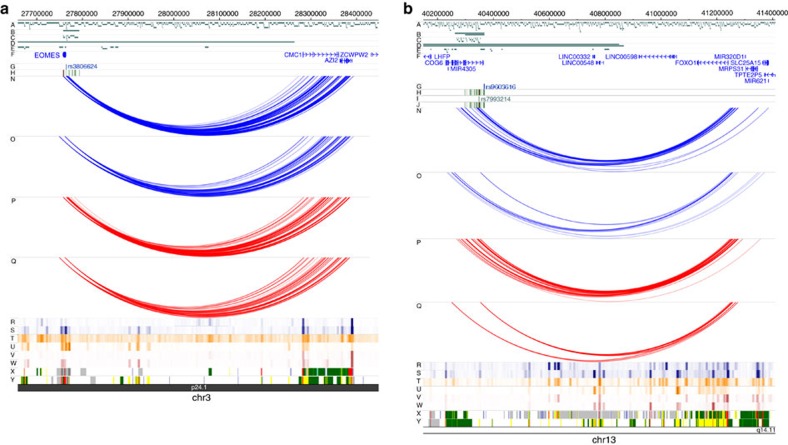
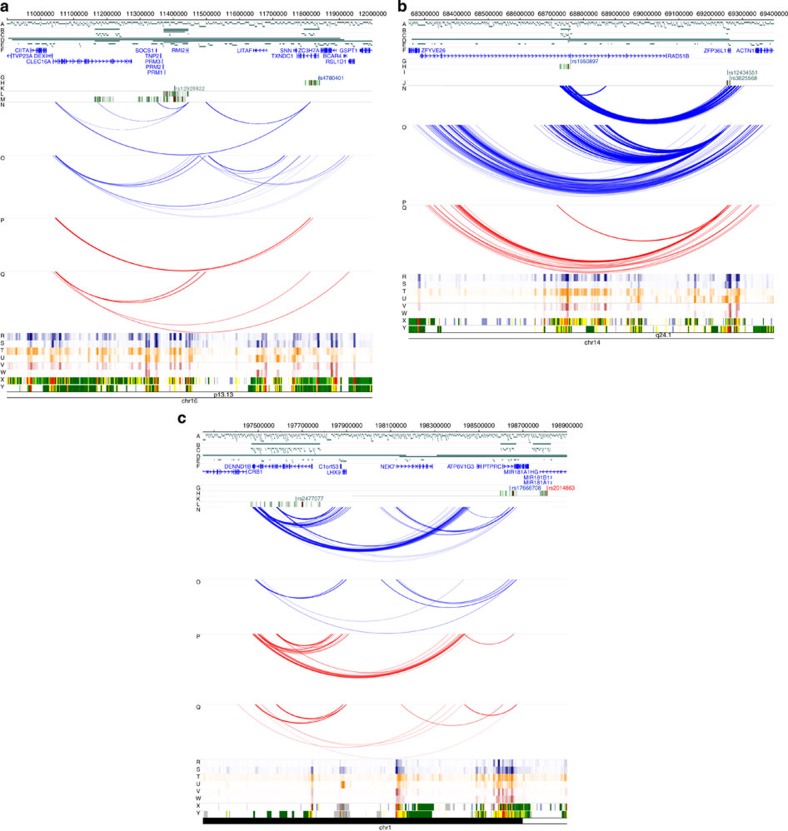
Genome-wide association studies have been tremendously successful in identifying genetic variants associated with complex diseases. The majority of association signals are intergenic and evidence is accumulating that a high proportion of signals lie in enhancer regions. We use Capture Hi-C to investigate, for the first time, the interactions between associated variants for four autoimmune diseases and their functional targets in B- and T-cell lines. Here we report numerous looping interactions and provide evidence that only a minority of interactions are common to both B- and T-cell lines, suggesting interactions may be highly cell-type specific; some disease-associated SNPs do not interact with the nearest gene but with more compelling candidate genes (for example, FOXO1, AZI2) often situated several megabases away; and finally, regions associated with different autoimmune diseases interact with each other and the same promoter suggesting common autoimmune gene targets (for example, PTPRC, DEXI and ZFP36L1).


Figures

Figure 1
Figure 1. A schematic of a hypothetical associated region including possible chromatin interactions.
Chromatin interactions are shown by arcs, those above the promoter capture target region are observed in the ‘Region Capture' experiment; those below are observed in the ‘Promoter Capture' experiment. All potential chromatin interactions are shown and are coloured by their potential to appear and be validated in both capture experiments. Those in green are observed in both the ‘Region Capture' and the ‘Promoter Capture' and comprise the ‘confirmed' interaction set. Interactions shown in purple are only present in one capture experiment and were therefore not validated. Other interactions (red, orange and blue) would only be observed in either the ‘Region Capture' or ‘Promoter Capture' and could therefore not be validated as described. The inset shows a magnified view of the associated region (as defined by LD) detailing which restriction fragments were targeted in the ‘Region Capture' and which were excluded as they appeared in the ‘Promoter Capture'.
Figure 2
Figure 2. Flowchart summarizing capture Hi-C experiments by cell line.
The ‘Region Capture' experiment is shown on the left and the ‘Promoter Capture' experiment on the right. Flowchart sections are coloured by cell type: light blue—GM12878 cells; light grey—Jurkat cells and grey—both cell types. Each section label is shown in dark blue.
Figure 3
Figure 3. Fold enrichment.
Fold enrichment of retained interactions called in the promoter capture experiments with decreasing FDR thresholds, given they had been called in the region capture experiments at the FDR threshold shown. ‘—' shows the enrichment found by focusing only on interactions called in the region capture experiments for which the other end lay in a HindIII restriction fragment targeted in the promoter capture design.
Figure 4
Figure 4. Examples of chromatin interactions implicating novel gene candidates.
(a) EOMES SNPs—both GM12878 and Jurkat cell lines show that SNPs situated proximal to the EOMES gene interact with the promoter of AZI2I, involved in NFκB activation, situated ∼640 kb away. (b) COG6 SNPs—interactions are shown that link SNPs within the COG6 to the FOXO1 promoter, over 1 Mb away, in both cell types. Genomic co-ordinates are shown along the top of each panel and tracks are labelled A–Y (empty tracks removed for clarity): (A) HindIII restriction fragments; (B–E) Regions targeted and restriction fragments included in the region (B,C) and promoter (D,E) capture experiments; (F) RefSeq Genes from the UCSC Genome Browser, downloaded 1 January 2012; (G,I,K) Index SNPs identified for RA (G), JIA (I) and PsA (K). Associations in red were identified in the RA Immunochip study. SNPs in blue were novel associations identified in the RA trans-ethnic GWAS meta-analysis, JIA and PsA SNPs were identified in the JIA and PsA Immunochip studies; (H,J,L) Density plots showing 1000 Genomes SNPs in LD (r2≥0.8) with the index SNPs (green–red) for RA (H), JIA (J) and PsA (L); (M) T1D Credible set SNPs identified in the T1D Immunochip study; (N–Q) Significant Interactions identified in the region and promoter capture experiments in GM12878 (N,O) and Jurkat (P,Q) cells; (R–Y) Data from the WashU Encode track hub showing DNaseI HS sites, H3K4me1 histone marks and H3K27ac histone marks for GM12878 (R,T,V) and CD3 Primary (S,U,W) cells and BROAD ChromHMM states for GM12878 (X) and CD4 Naive Primary cells (Y).
Figure 5
Figure 5. Examples of chromatin interactions linking several disease associations to a common promoter.
(a) DEXI—both GM12878 and Jurkat cell lines show that SNPs associated independently with RA, PsA and T1D interact with the DEXI promoter. In addition, evidence suggests that the RA and JIA SNP regions interact in GM12878 cells. (b) RAD51B—RA associations located within a strong enhancer are shown to interact with the promoter of ZFP36L1, a gene involved in B-cell transition, which also contains SNPs associated with JIA. (c), PTPRC—Variants associated with PsA, within the DENND1B are shown to interact with PTPRC, a region independently associated with RA. Genomic co-ordinates are shown along the top of each panel and tracks are labelled A—Y as in Fig. 4.

References

    1. Ward L. D. & Kellis M. Interpreting noncoding genetic variation in complex traits and human disease. Nat. Biotechnol. 30, 1095–1106 (2012). - PMC - PubMed
    1. Fairfax B. P. et al. Innate immune activity conditions the effect of regulatory variants upon monocyte gene expression. Science 343, 1246949 (2014). - PMC - PubMed
    1. Farh K. K. et al. Genetic and epigenetic fine mapping of causal autoimmune disease variants. Nature 518, 337–343 (2015). - PMC - PubMed
    1. Ye C. J. et al. Intersection of population variation and autoimmunity genetics in human T cell activation. Science 345, 1254665 (2014). - PMC - PubMed
    1. Schoenfelder S., Clay I. & Fraser P. The transcriptional interactome: gene expression in 3D. Curr. Opin. Genet. Dev. 20, 127–133 (2010). - PubMed

Publication types