

REST-Governed Gene Expression Profiling in a Neuronal Cell Model Reveals Novel Direct and Indirect Processes of Repression and Up-Regulation
- PMID: 26617488
- PMCID: PMC4639699
- DOI: 10.3389/fncel.2015.00438
REST-Governed Gene Expression Profiling in a Neuronal Cell Model Reveals Novel Direct and Indirect Processes of Repression and Up-Regulation
Abstract
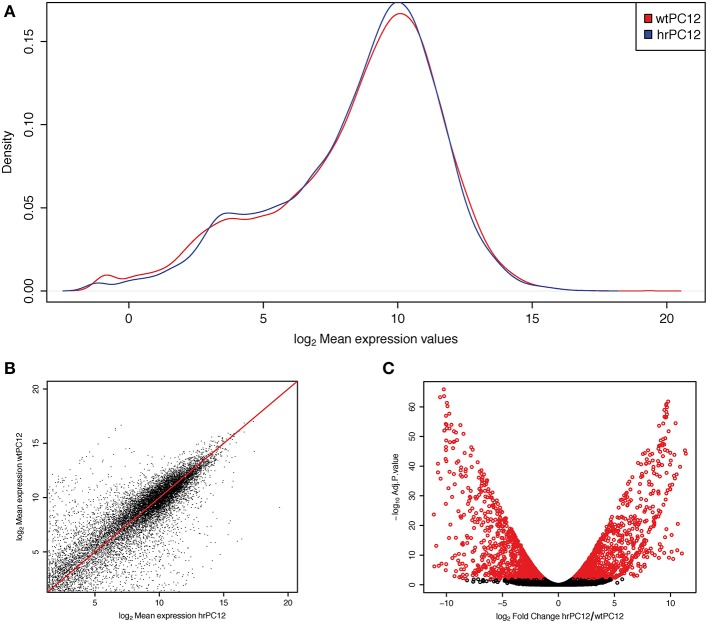
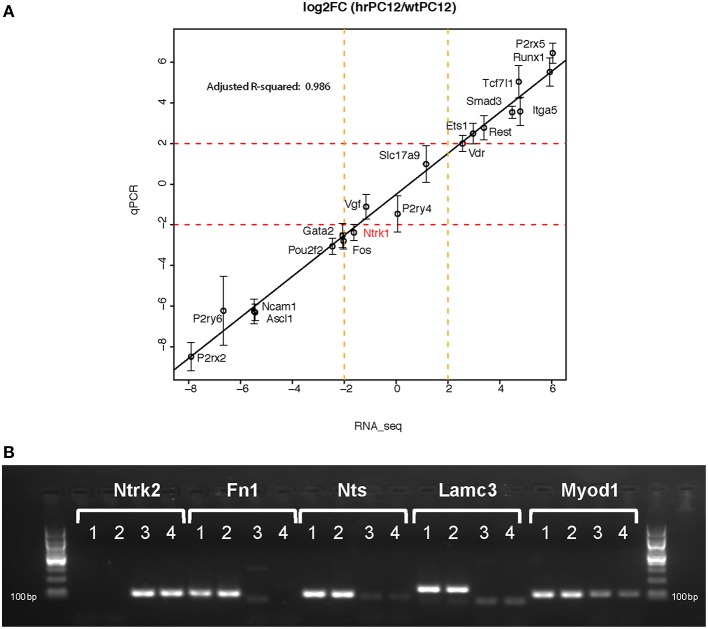
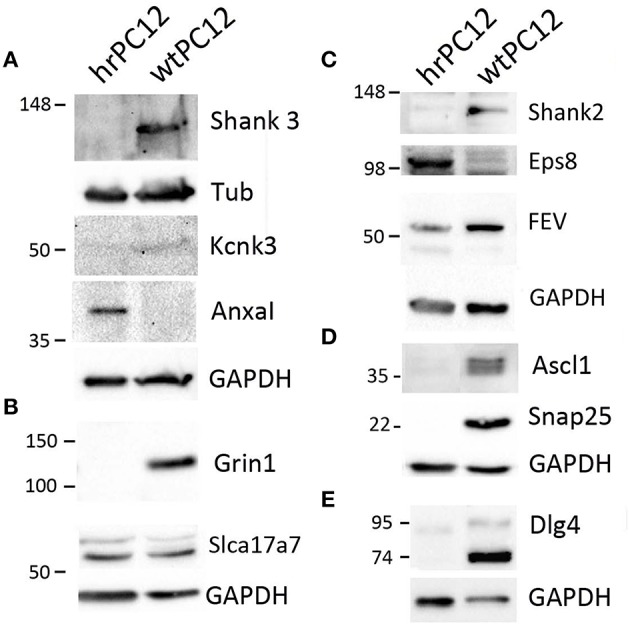
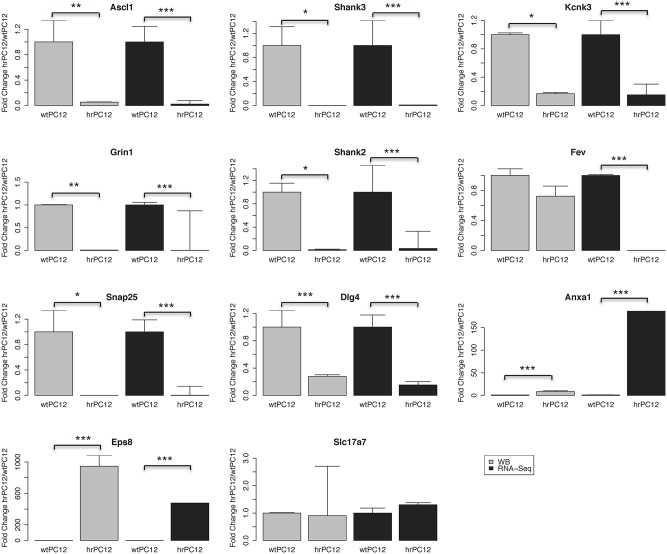
The role of REST changes in neurons, including the rapid decrease of its level during differentiation and its fluctuations during many mature functions and diseases, is well established. However, identification of many thousand possible REST-target genes, mostly based on indirect criteria, and demonstration of their operative dependence on the repressor have been established for only a relatively small fraction. In the present study, starting from our recently published work, we have expanded the identification of REST-dependent genes, investigated in two clones of the PC12 line, a recognized neuronal cell model, spontaneously expressing different levels of REST: very low as in neurons and much higher as in most non-neural cells. The molecular, structural and functional differences of the two PC12 clones were shown to depend largely on their different REST level and the ensuing variable expression of some dependent genes. Comprehensive RNA-Seq analyses of the 13,700 genes expressed, validated by parallel RT-PCR and western analyses of mRNAs and encoded proteins, identified in the high-REST clone two groups of almost 900 repressed and up-regulated genes. Repression is often due to direct binding of REST to target genes; up-regulation to indirect mechanism(s) mostly mediated by REST repression of repressive transcription factors. Most, but not all, genes governing neurosecretion, excitability, and receptor channel signaling were repressed in the high REST clone. The genes governing expression of non-channel receptors (G protein-coupled and others), although variably affected, were often up-regulated together with the genes of intracellular kinases, small G proteins, cytoskeleton, cell adhesion, and extracellular matrix proteins. Expression of REST-dependent genes governing functions other than those mentioned so far were also identified. The results obtained by the parallel investigation of the two PC12 clones revealed the complexity of the REST molecular and functional role, deciphering new aspects of its participation in neuronal functions. The new findings could be relevant for further investigation and interpretation of physiological processes typical of neurons. Moreover, they could be employed as tools in the study of neuronal diseases recently shown to depend on REST for their development.
Keywords: PC12 clones; RNA-Seq; cooperative transcription factors; different REST levels; differential gene expression; gene repression and up-regulation.
Figures
Similar articles
-
Epigenomics of Neural Cells: REST-Induced Down- and Upregulation of Gene Expression in a Two-Clone PC12 Cell Model.Biomed Res Int. 2015;2015:202914. doi: 10.1155/2015/202914. Epub 2015 Aug 27. Biomed Res Int. 2015. PMID: 26413508 Free PMC article.
-
In PC12 cells, expression of neurosecretion and neurite outgrowth are governed by the transcription repressor REST/NRSF.Cell Mol Neurobiol. 2010 Nov;30(8):1295-302. doi: 10.1007/s10571-010-9602-0. Epub 2010 Nov 3. Cell Mol Neurobiol. 2010. PMID: 21046448 Free PMC article. Review.
-
The rest repression of the neurosecretory phenotype is negatively modulated by BHC80, a protein of the BRAF/HDAC complex.J Neurosci. 2009 May 13;29(19):6296-307. doi: 10.1523/JNEUROSCI.5943-08.2009. J Neurosci. 2009. PMID: 19439607 Free PMC article.
-
A signaling loop of REST, TSC2 and β-catenin governs proliferation and function of PC12 neural cells.J Cell Sci. 2011 Sep 15;124(Pt 18):3174-86. doi: 10.1242/jcs.087551. Epub 2011 Aug 24. J Cell Sci. 2011. PMID: 21868364
-
Expression of dense-core vesicles and of their exocytosis are governed by the repressive transcription factor NRSF/REST.Ann N Y Acad Sci. 2009 Jan;1152:194-200. doi: 10.1111/j.1749-6632.2008.03988.x. Ann N Y Acad Sci. 2009. PMID: 19161390 Review.
Cited by
-
Alternative Splicing by NOVA Factors: From Gene Expression to Cell Physiology and Pathology.Int J Mol Sci. 2020 May 30;21(11):3941. doi: 10.3390/ijms21113941. Int J Mol Sci. 2020. PMID: 32486302 Free PMC article. Review.
-
News about the Role of the Transcription Factor REST in Neurons: From Physiology to Pathology.Int J Mol Sci. 2019 Dec 29;21(1):235. doi: 10.3390/ijms21010235. Int J Mol Sci. 2019. PMID: 31905747 Free PMC article. Review.
-
REST Is Restless in Neuronal and Non-Neuronal Virus Infections: An In Silico Analysis-Based Perspective.Viruses. 2025 Feb 8;17(2):234. doi: 10.3390/v17020234. Viruses. 2025. PMID: 40006989 Free PMC article. Review.
-
Regulatory Architecture of the Neuronal Cacng2/Tarpγ2 Gene Promoter: Multiple Repressive Domains, a Polymorphic Regulatory Short Tandem Repeat, and Bidirectional Organization with Co-regulated lncRNAs.J Mol Neurosci. 2019 Feb;67(2):282-294. doi: 10.1007/s12031-018-1208-x. Epub 2018 Nov 26. J Mol Neurosci. 2019. PMID: 30478755 Free PMC article.
References
-
- Benjamini Y., Hochberg Y. (1995). Controlling the false discovery rate: a practical and powerful approach to multiple testing. J. Royal Stat. Soc. B 57, 289–300.
Grants and funding
LinkOut - more resources
Full Text Sources
Other Literature Sources