. 2015 Nov 12:6:237.
doi: 10.3389/fneur.2015.00237. eCollection 2015.

Plasma 24-metabolite Panel Predicts Preclinical Transition to Clinical Stages of Alzheimer's Disease

Affiliations

Plasma 24-metabolite Panel Predicts Preclinical Transition to Clinical Stages of Alzheimer's Disease

Massimo S Fiandaca et al. Front Neurol. .

Abstract

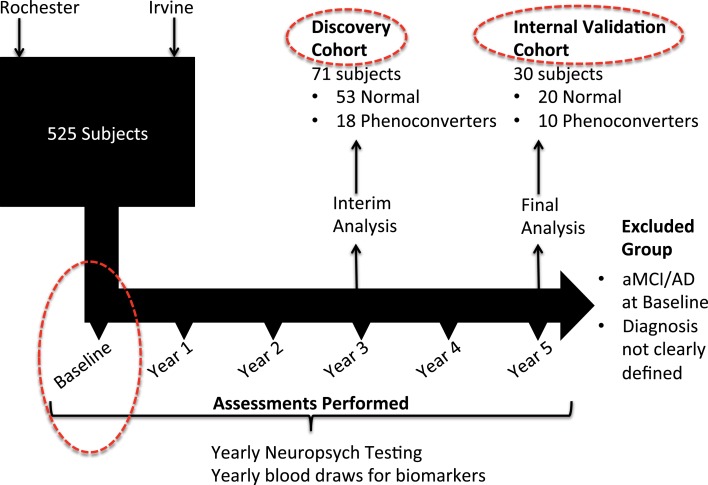
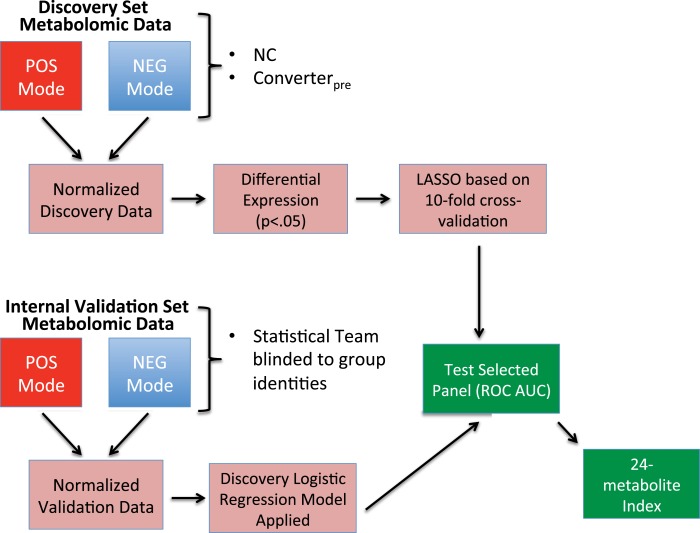
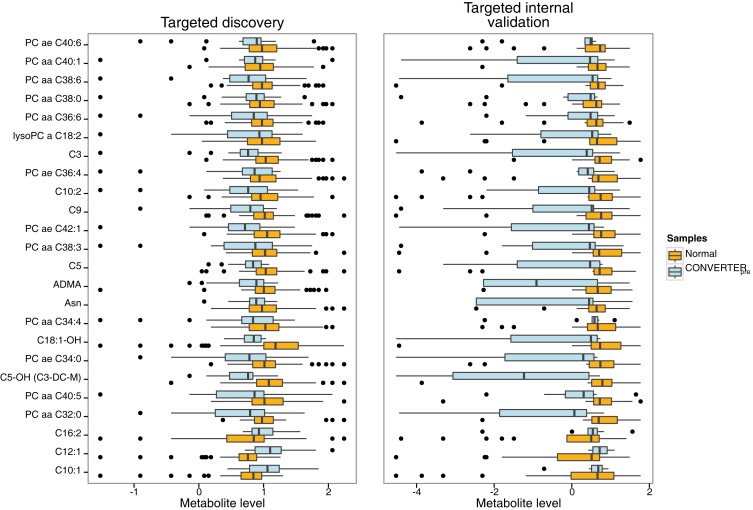
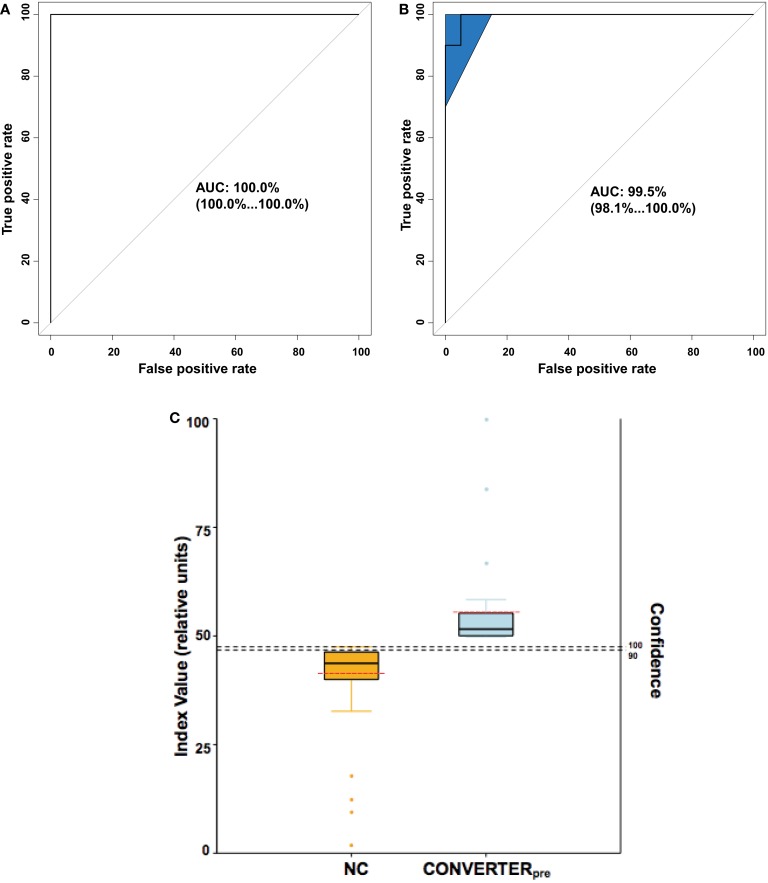
We recently documented plasma lipid dysregulation in preclinical late-onset Alzheimer's disease (LOAD). A 10 plasma lipid panel, predicted phenoconversion and provided 90% sensitivity and 85% specificity in differentiating an at-risk group from those that would remain cognitively intact. Despite these encouraging results, low positive predictive values limit the clinical usefulness of this panel as a screening tool in subjects aged 70-80 years or younger. In this report, we re-examine our metabolomic data, analyzing baseline plasma specimens from our group of phenoconverters (n = 28) and a matched set of cognitively normal subjects (n = 73), and discover and internally validate a panel of 24 plasma metabolites. The new panel provides a classifier with receiver operating characteristic area under the curve for the discovery and internal validation cohort of 1.0 and 0.995 (95% confidence intervals of 1.0-1.0, and 0.981-1.0), respectively. Twenty-two of the 24 metabolites were significantly dysregulated lipids. While positive and negative predictive values were improved compared to our 10-lipid panel, low positive predictive values provide a reality check on the utility of such biomarkers in this age group (or younger). Through inclusion of additional significantly dysregulated analyte species, our new biomarker panel provides greater accuracy in our cohort but remains limited by predictive power. Unfortunately, the novel metabolite panel alone may not provide improvement in counseling and management of at-risk individuals but may further improve selection of subjects for LOAD secondary prevention trials. We expect that external validation will remain challenging due to our stringent study design, especially compared with more diverse subject cohorts. We do anticipate, however, external validation of reduced plasma lipid species as a predictor of phenoconversion to either prodromal or manifest LOAD.

Keywords: Alzheimer’s disease; biomarkers; economics; ethics; lipids; metabolomics; risk assessment.


Figures

Figure 1
Figure 1
Schematic representation of overall study design and specific analyses reported in this paper. Clinical subjects for the 5-year observational study were selected for participation at the University of Rochester and the University of California Irvine. An interim analysis was performed at year 3 of the study, comparing 53 subjects who maintained normal cognition since baseline study entry, to a group of 18 subjects who were cognitively normal at baseline but had phenoconverted to either aMCI or AD by year 3. This group made up our discovery cohort from which initial biomarker discovery was performed. With complete neuropsychological assessments available by study termination, an additional group of 10 subjects were noted to have phenoconverted during year 4 and year 5. This latter group was combined with a group of 20 matched subjects who maintained normal cognition throughout the study, and together were designated as the internal validation group (or cohort). All subjects included in this analysis (Discovery and Internal Validation cohorts) had only their baseline blood specimens assessed for metabolomic biomarker comparisons (dashed red circles).
Figure 2
Figure 2
Flow chart showing steps in biomarker model development. Discovery cohort information was obtained from baseline specimen metabolomic data from subjects who remained cognitively normal (NC) throughout the study and baseline specimens from those that phenoconverted (Converterpre) during the study’s first 3 years. Discovery metabolomic data from positive and negative modes underwent normalization, followed by selection of significantly altered metabolites (p < 0.05), which were then annotated. The significant, annotated biomarker panel was then defined via a regularized learning method that features the LASSO restriction. The discovery biomarker panel selected is then tested using the receiver operating characteristic area under the curve (ROC AUC) method. With the statistical team blinded to group identities, the Internal Validation cohort data were similarly normalized and annotated. Internal Validation data were subjected to the results of the discovery logistic regression classifier and tested using the ROC AUC method. Combined data from the discovery and internal validation sets were used to develop a 24-metabolite index.
Figure 3
Figure 3
Horizontal box and whisker plots of plasma 24 metabolite panel results for clinical groups in discovery and internal validation cohorts. Comparative ranges of plasma metabolite levels for the targeted discovery and internal validation studies are displayed, allowing appraisal of metabolite results in the cognitively intact normal (orange) versus Converterpre (light blue) groups. The box defines the interquartile range (IQR) with the vertical black line within the box representing the median value. The whiskers define the upper and lower 25% limits of the data, while the dots represent outliers (≥1.5 IQR lengths from the ends of the box). The normal group featured 53 subjects in the discovery and 20 in the internal validation cohorts, while the Converterpre group included 18 and 10 subjects, for discovery and internal validation cohorts, respectively. Individual analytes are listed on the left vertical axis, while normalized metabolite levels are shown on the horizontal axis. All the Converterpre analyte results are reduced in comparison to NC levels, except for three acylcarnitine species (bottom of figure), C16:2, C12:1, and C10:1, which are elevated. Note the higher variability of the internal validation set compared to the discovery set, due to less than half of the number of subjects in the former compared to the latter.
Figure 4
Figure 4
Analytic representations to discriminate Converterpre from normal control (NC) subjects. (A,B) provide receiver operating characteristic (ROC) curves, whereas (C) depicts the calculated plasma 24 metabolite index (P24MI). (A) ROC area under the curve (AUC) for the Discovery cohort was equal to 1.00 with 95% confidence interval (in parentheses) ranging from 1.00 to 1.00. (B) ROC AUC for the internal validation cohort was 0.995, with 95% confidence interval (shaded area on plot) ranging from 0.981 to 1.00. (C) The P24MI results are depicted in vertical boxplots based on the logistic regression model that distinguishes between Converterpre and NC groups. Solid black horizontal lines represent the mean value, while the dashed red horizontal lines represent the median value. Orange and light blue dots represent outliers (≥1.5 IQR lengths from the ends of the box). The higher index values (left vertical axis) are associated with an increased risk of phenoconversion to aMCI or AD, as seen in our Converterpre subjects, with confidence (right vertical axis) of predicting phenoconversion transitioning from 90 to 100% at an relative index value of 48. Based on the calculated P24MI in our current dataset, a relative index value ≥49 represents a Converterpre individual and a risk of phenoconversion of 100% within the 5-year study range. Note the relatively low variability of the P24MI for both the NC group and the Converterpre group, with no overlap.
Figure 5
Figure 5
Schematic representations of potential alterations within brain and peripheral blood responsible for reduced plasma phospholipid levels. (A) Qualitative dot plot of differential changes occurring in cognitively normal control (NC), cognitively normal Converterpre (Cpre) subjects, and those with amnestic mild cognitive impairment or Alzheimer’s disease (aMCI/AD). Note that all four processes (represented within boxed legend) are at the zero relative level in the NC subjects. The Cpre subjects could show significant polyunsaturated fatty acid (PUFA) transport into brain to replenish lost substrate as a result of neuroinflammation or other brain injury. The increase in PUFA flux into the brain is an attempt to compensate for ongoing injury and results in a marked reduction in the plasma levels of molecules carrying those lipid species. Dark horizontal line within boxes represents proposed mean. (B) Qualitative plasma phospholipid biomarker results, previously quantified (2), which may be better interpreted via the theory proposed in (A). Dark horizontal line within boxes represents proposed mean. The full explanation for this metabolic phenomenon in the Cpre subjects remains to be elucidated.

References

    1. Sperling RA, Aisen PS, Beckett LA, Bennett DA, Craft S, Fagan AM, et al. Toward defining the preclinical stages of Alzheimer’s disease: recommendations from the National Institute on Aging-Alzheimer’s Association workgroups on diagnostic guidelines for Alzheimer’s disease. Alzheimers Dement (2011) 7:280–92.10.1016/j.jalz.2011.03.003 - DOI - PMC - PubMed
    1. Mapstone M, Cheema AK, Fiandaca MS, Zhong X, Mhyre TR, Macarthur LH, et al. Plasma phospholipids identify antecedent memory impairment in older adults. Nat Med (2014) 20:415–8.10.1038/nm.3466 - DOI - PMC - PubMed
    1. Fiandaca MS, Mapstone M, Cheema AK, Federoff HJ. The critical need for defining preclinical biomarkers in Alzheimer’s disease. Alzheimers Dement (2014) 10:S195–211.10.1016/j.jalz.2014.04.015 - DOI - PubMed
    1. Zweig MH, Campbell G. Receiver-operating characteristic (ROC) plots: a fundamental evaluation tool in clinical medicine. Clin Chem (1993) 39:561–77. - PubMed
    1. Whiley L, Sen A, Heaton J, Proitsi P, Garcia-Gomez D, Leung R, et al. Evidence of altered phosphatidylcholine metabolism in Alzheimer’s disease. Neurobiol Aging (2014) 35:271–8.10.1016/j.neurobiolaging.2013.08.001 - DOI - PMC - PubMed