. 2015 Nov 9:6:936.
doi: 10.3389/fpls.2015.00936. eCollection 2015.

Variation for N Uptake System in Maize: Genotypic Response to N Supply

Affiliations

Variation for N Uptake System in Maize: Genotypic Response to N Supply

Trevor Garnett et al. Front Plant Sci. .

Abstract

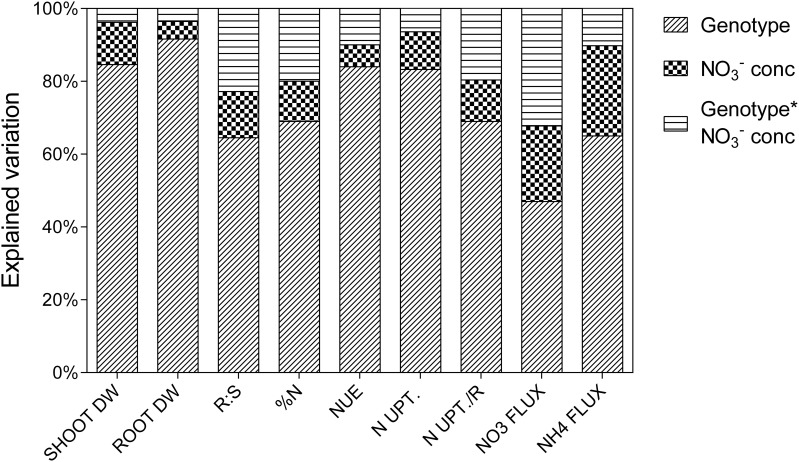
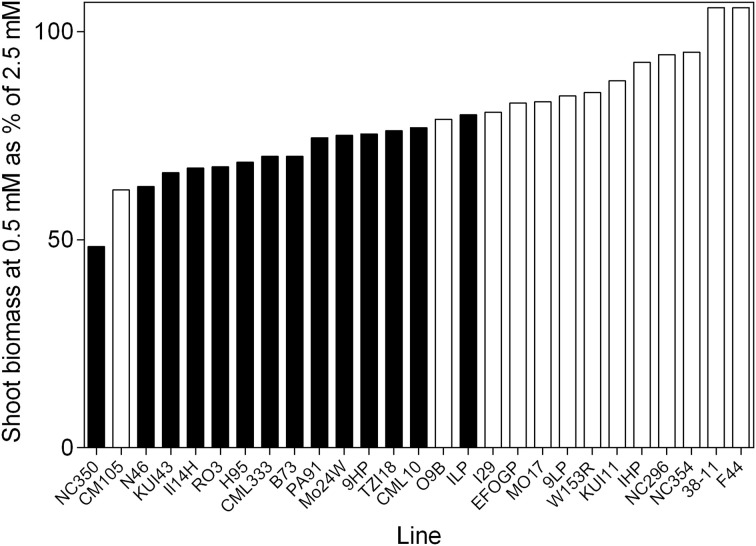
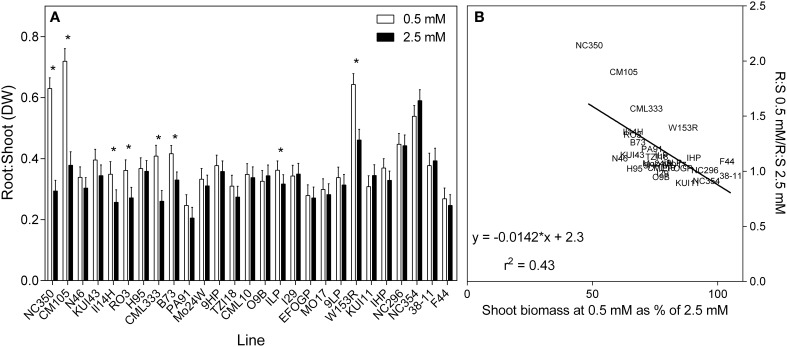
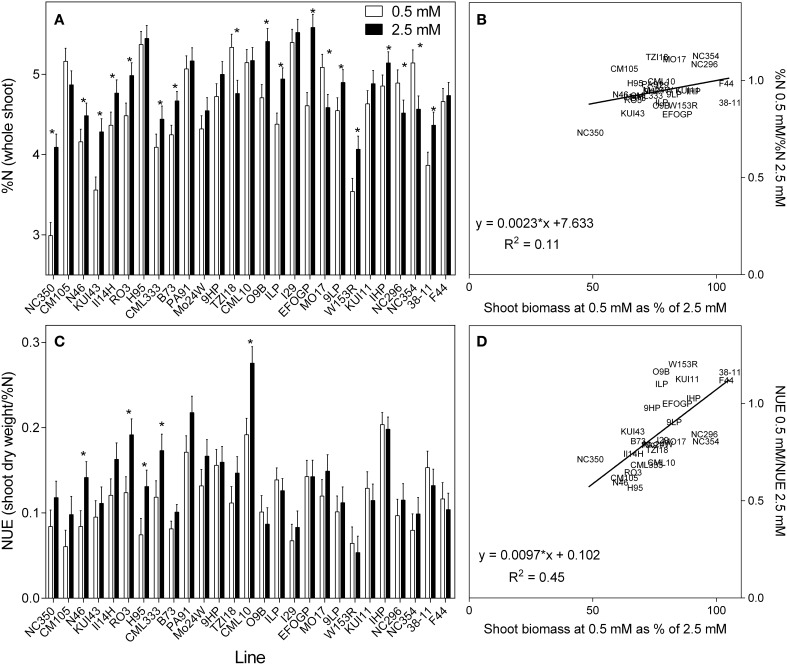
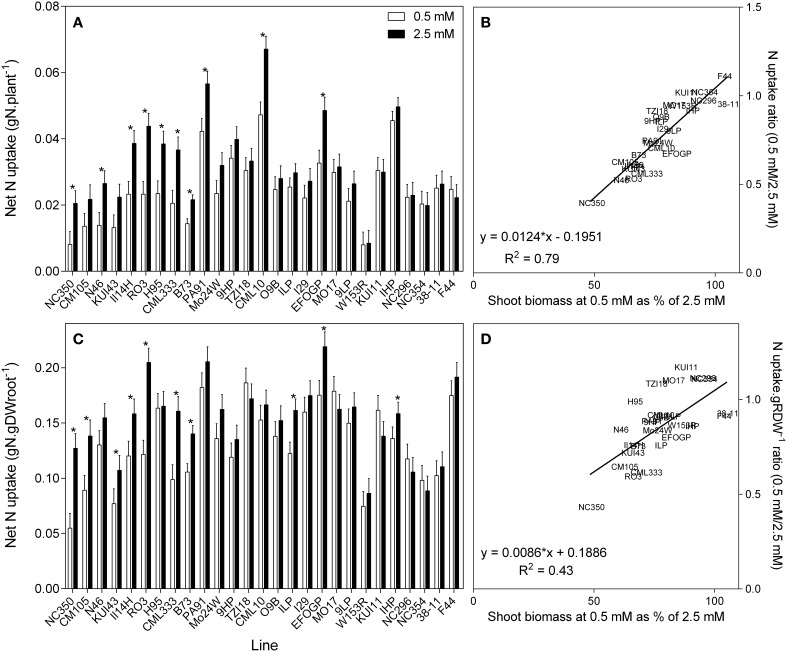
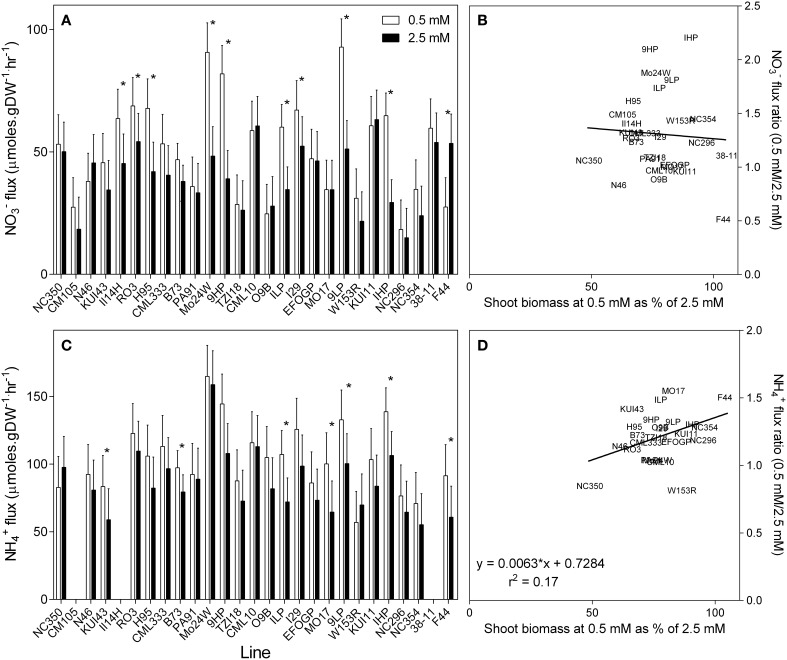
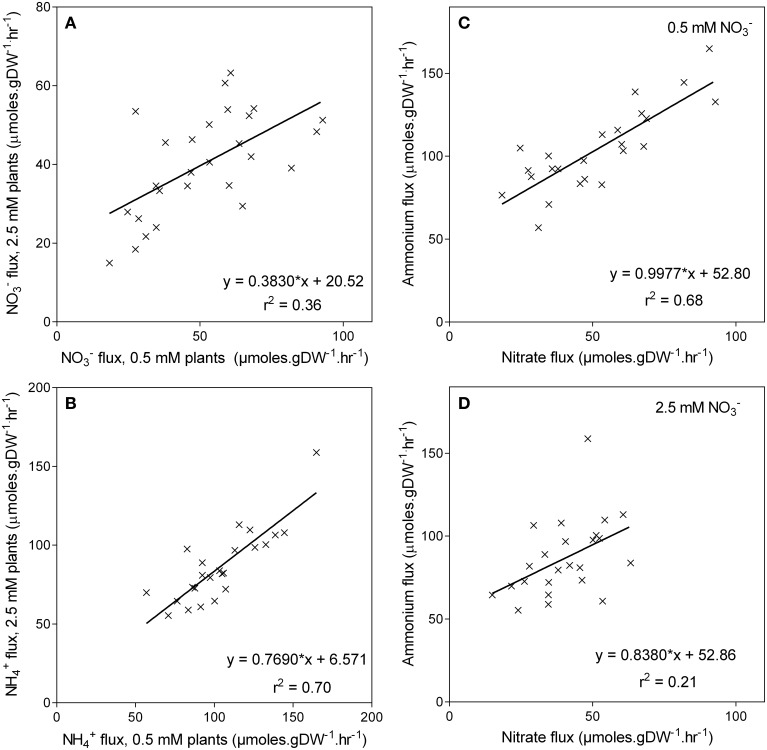
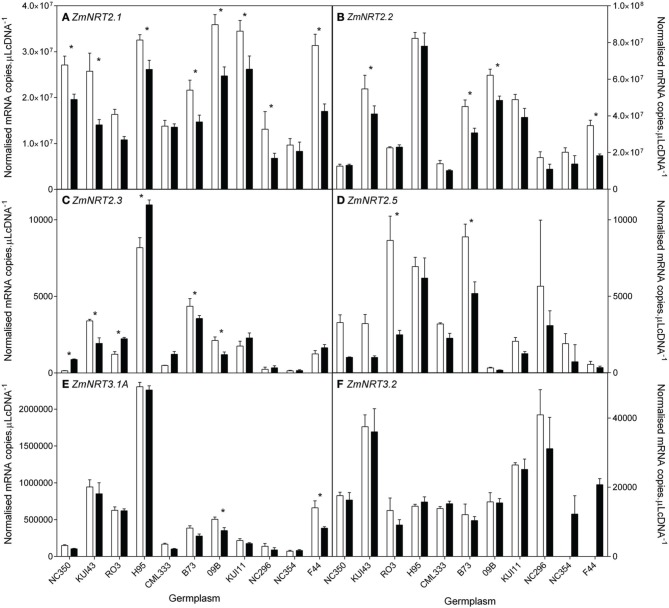
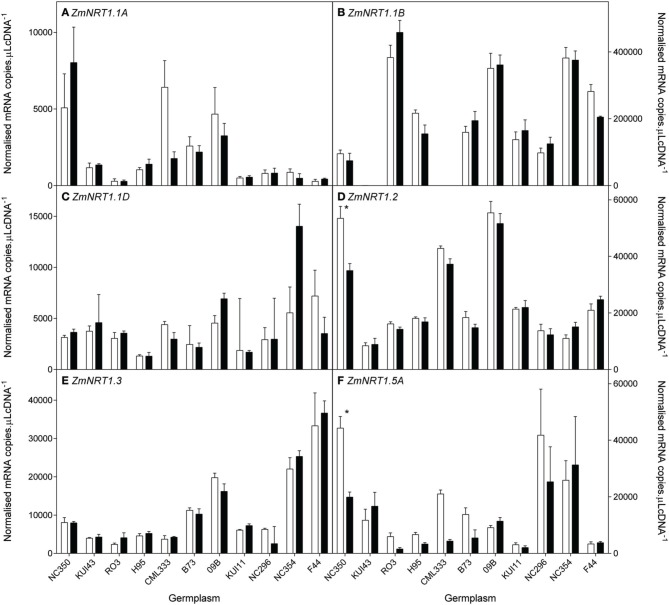
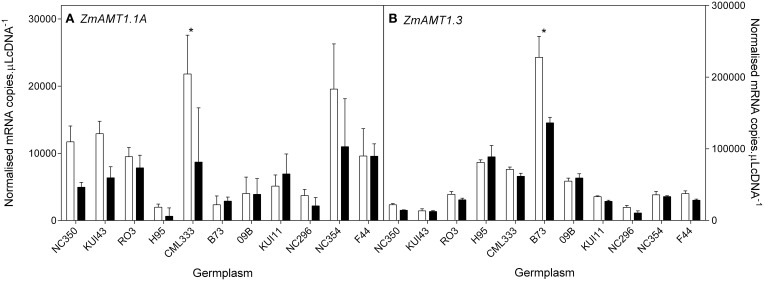
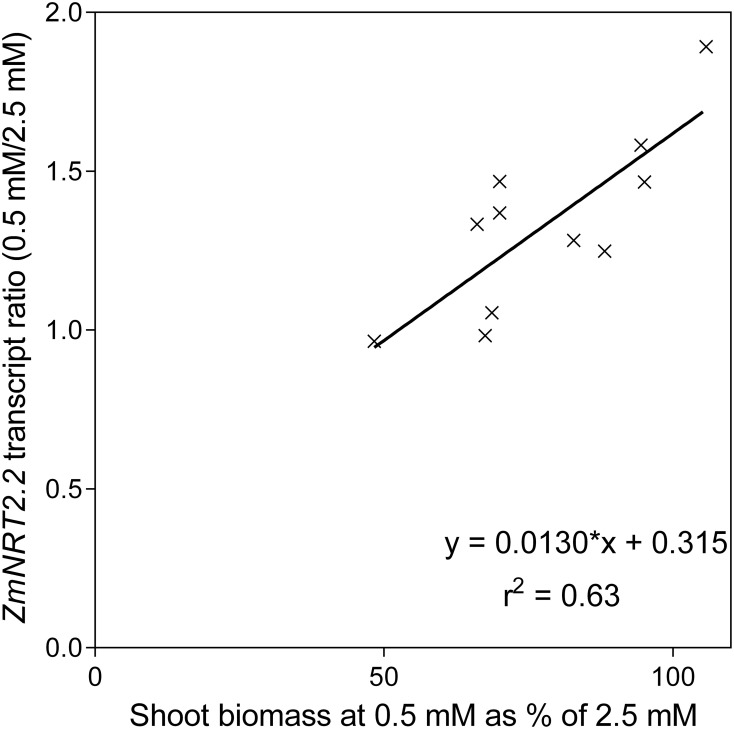
An understanding of the adaptations made by plants in their nitrogen (N) uptake systems in response to reduced N supply is important to the development of cereals with enhanced N uptake efficiency (NUpE). Twenty seven diverse genotypes of maize (Zea mays, L.) were grown in hydroponics for 3 weeks with limiting or adequate N supply. Genotypic response to N was assessed on the basis of biomass characteristics and the activities of the nitrate ([Formula: see text]) and ammonium ([Formula: see text]) high-affinity transport systems. Genotypes differed greatly for the ability to maintain biomass with reduced N. Although, the N response in underlying biomass and N transport related characteristics was less than that for biomass, there were clear relationships, most importantly, lines that maintained biomass at reduced N maintained net N uptake with no change in size of the root relative to the shoot. The root uptake capacity for both [Formula: see text] and [Formula: see text] increased with reduced N. Transcript levels of putative [Formula: see text] and [Formula: see text] transporter genes in the root tissue of a subset of the genotypes revealed that predominately ZmNRT2 transcript levels responded to N treatments. The correlation between the ratio of transcripts of ZmNRT2.2 between the two N levels and a genotype's ability to maintain biomass with reduced N suggests a role for these transporters in enhancing NUpE. The observed variation in the ability to capture N at low N provides scope for both improving NUpE in maize and also to better understand the N uptake system in cereals.

Keywords: N; NUE; Zea mays; ammonium; nitrate; nitrogen use efficiency; uptake.


Figures

Figure 1
Figure 1
Psuedo ANOVA results showing percentage of explained variation attributed to the treatments for each traits. Shoot dry weight (SHOOT DW, g); root dry weight (ROOT DW, g); ratio of root to shoot dry weight (R:S); shoot % N (%N); vegetative NUE (NUE, %N/g DW); net N uptake to shoot (N UPT., gN); net N uptake to shoot relative to root dry weight (N UPT./R, gN.gDWroot−1); NO3 flux (NO3 FLUX, nm.gDW−1.h−1); NH4+ flux (NH4 FLUX, nm.gDW−1.h−1).
Figure 2
Figure 2
The ability of 21 day old maize genotypes to retain biomass when grown at 0.5 mM nitrate with respect to growth at 2.5 mM nitrate. Values are the predicted values of shoot biomass of plants grown at 0.5 mM NO3 as a percentage of the predicted shoot biomass at 2.5 mM NO3. Filled bars represent lines that are significantly smaller in the low N treatment at 0.05 significance level.
Figure 3
Figure 3
Ratio of root to shoot dry weights of 21 day old maize genotypes grown at either 0.5 mM NO3 or 2.5 mM NO3(values are predicted values ± standard error, n = 8). (A) Genotypes are ordered from left to right according to their ability to retain biomass as shown in Figure 2 and (B) the scatterplot displaying the regression describing the relationship.
Figure 4
Figure 4
The nitrogen (%) in the whole shoot (A), and NUE (shoot biomass per unit of N) (C) of 21 day old maize genotypes grown at either 0.5 mM nitrate or 2.5 mM nitrate. Values are predicted values ± standard error (n = 8), * indicates those genotypes where %N and NUE were significantly different between the two growth conditions at the 0.05 significance level. Genotypes are ordered from left to right according to their ability to retain biomass as shown in Figure 2. Scatterplots (B,D) are the ratio of the values at each nitrate concentration plotted against ability to retain biomass.
Figure 5
Figure 5
Net nitrogen uptake to the shoot (A), and net nitrogen uptake to the shoot relative to root size (C) of 21 day old maize genotypes grown at either 0.5 mM nitrate or 2.5 mM NO3 (values are predicted values ± standard error (n = 8), * indicates those points that are significantly different between the two growth conditions at 0.05 significance level. Genotypes are ordered from left to right according to their ability to retain biomass as shown in Figure 2. Scatterplots (B,D) are the ratio of the values at each nitrate concentration plotted against ability to retain biomass.
Figure 6
Figure 6
Unidirectional influx of NO3 (A) and NH4+ (C) into the roots of maize genotypes grown at either 0.5 mM or 2.5 mM NO3. Nitrate and NH4+ influx were measured using15N labeled NO3 or NH4+ over a 10-min influx period from a 200 μM solution. Values are predicted values ± standard error (n = 4) * indicates those points that are significantly different between the two growth conditions at 0.05 significance level. Genotypes are ordered from left to right according to their ability to retain biomass as shown in Figure 2. Missing values for NH4+ flux are due to no measurement of NH4+ flux being made on these lines. Scatterplots (B,D) are the ratio of the values at each nitrate concentration plotted against their ability to retain biomass.
Figure 7
Figure 7
Unidirectional influx of NO3 and NH4+into the roots of maize genotypes grown at either 0.5 mM or 2.5 mM NO3. Panels (A,B) show the relationships between the fluxes of either NO3 (A) or NH4+ (B) for each NO3 treatment; the relationship between the fluxes for each NO3 treatment is shown in Panels (C,D). Nitrate and NH4+ influx were measured using15N labeled NO3 or NH4+ over a 10-min influx period from a 200 μM solution.
Figure 8
Figure 8
Root transcript levels of putative high affinity (NRT2) NO3 transporters (A–D) and two putative NRT3 (E,F) proteins in diverse maize genotypes grown in nutrient solution containing either 0.5 mM (open bars) or 2.5 mM (closed bars) NO3. Each data point is normalized against control genes (ZmGaPDh, ZmActin, ZmTubulin, and ZmElF1). Values are means ± SEM (n = 4), * indicates those points that are significantly different between the two growth conditions at 0.05 significance level. Genotypes are ordered from left to right according to their ability to retain biomass as shown in Figure 2.
Figure 9
Figure 9
Root transcript levels of various putative low affinity (NRT1) NO3 transporters (A–F) in diverse maize genotypes grown in nutrient solution containing either 0.5 mM (open bars) or 2.5 mM (closed bars) NO3. Each data point is normalized against control genes (ZmGaPDh, ZmActin, ZmTubulin, and ZmElF1). Values are means ± SEM (n = 4), * indicates those points that are significantly different between the two growth conditions at 0.05 significance level. Genotypes are ordered from left to right according to their ability to retain biomass as shown in Figure 2.
Figure 10
Figure 10
Root transcript levels of two putative AMT NH4+ transporters (A,B) in diverse maize genotypes grown in nutrient solution containing either 0.5 mM (open bars) or 2.5 mM (closed bars) NO3. Each data point is normalized against control genes (ZmGaPDh, ZmActin, ZmTubulin, and ZmElF1). Values are means ± SEM (n = 4), * indicates those points that are significantly different between the two growth conditions at 0.05 significance level. Genotypes are ordered from left to right according to their ability to retain biomass as shown in Figure 2.
Figure 11
Figure 11
The relationship between the ratio of ZmNRT2.2 transcript levels and the ability to maintain shoot biomass between nutrient solution containing either 0.5 mM or 2.5 mM NO3.

References

    1. Burns I. G. (1980). Influence of the spatial distribution of nitrate and the uptake of N by plants: a review and a model for rooting depth. J. Soil Sci. 31, 155–173. 10.1111/j.1365-2389.1980.tb02073.x - DOI
    1. Burton R. A., Jobling S. A., Harvey A. J., Shirley N. J., Mather D. E., Bacic A., et al. (2008). The genetics and transcriptional profiles of the cellulose synthase-like HvCslF gene family in barley. Plant Physiol. 146, 1821–1833. 10.1104/pp.107.114694 - DOI - PMC - PubMed
    1. Butler D., Cullis B. R., Gilmour A. R., Gogel B. J. (2010). Mixed models for S language environments. ASReml-R Reference Manual. Queensland: Queensland Government Department of Primary Industries and Fisheries.
    1. Chapin F. S. (1991). Integrated responses of plants to stress. Bioscience 41, 29–36. 10.2307/1311538 - DOI
    1. Chardon F., Barthelemy J., Daniel-Vedele F., Masclaux-Daubresse C. (2010). Natural variation of nitrate uptake and nitrogen use efficiency in Arabidopsis thaliana cultivated with limiting and ample nitrogen supply. J. Exp. Bot. 61, 2293–2302. 10.1093/jxb/erq059 - DOI - PubMed