. 2015 Nov 9:6:995.
doi: 10.3389/fpls.2015.00995. eCollection 2015.

Elevated Temperature Differentially Influences Effector-Triggered Immunity Outputs in Arabidopsis

Affiliations

Elevated Temperature Differentially Influences Effector-Triggered Immunity Outputs in Arabidopsis

Alexandra Menna et al. Front Plant Sci. .

Abstract

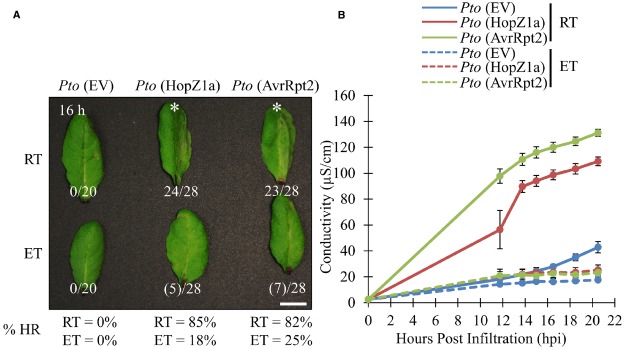
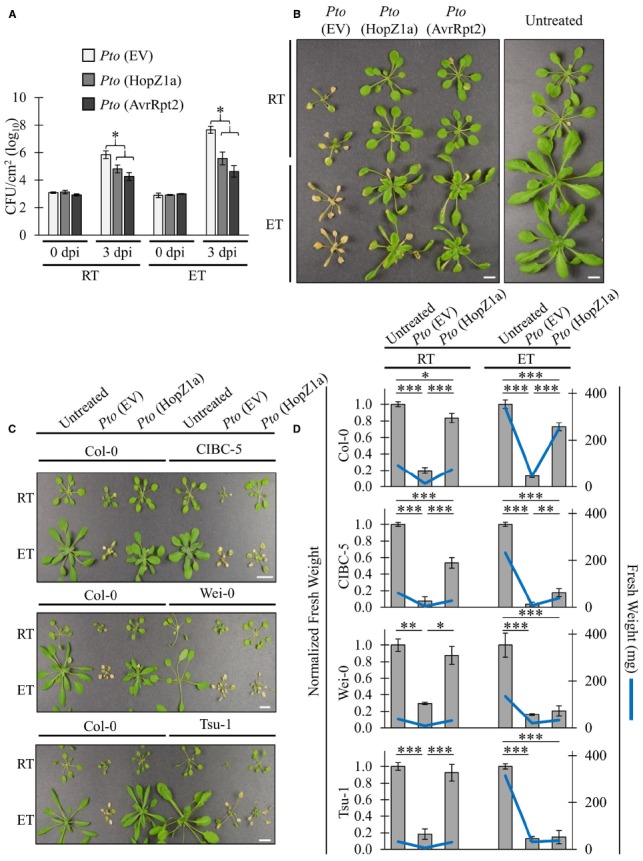
Pseudomonas syringae is a Gram-negative bacterium that infects multiple plant species by manipulating cellular processes via injection of type three secreted effectors (T3SEs) into host cells. Nucleotide-binding leucine-rich repeat (NLR) resistance (R) proteins recognize specific T3SEs and trigger a robust immune response, called effector-triggered immunity (ETI), which limits pathogen proliferation and is often associated with localized programmed cell death, known as the hypersensitive response (HR). In this study, we examine the influence of elevated temperature on two ETI outputs: HR and pathogen virulence suppression. We found that in the Arabidopsis thaliana accession Col-0, elevated temperatures suppress the HR, but have minimal influence on ETI-associated P. syringae virulence suppression, thereby uncoupling these two ETI responses. We also identify accessions of Arabidopsis that exhibit impaired P. syringae virulence suppression at elevated temperature, highlighting the natural variation that exists in coping with biotic and abiotic stresses. These results not only reinforce the influence of abiotic factors on plant immunity but also emphasize the importance of carefully documented environmental conditions in studies of plant immunity.

Keywords: Arabidopsis thaliana; Pseudomonas syringae; abiotic stress; disease resistance; effector-triggered immunity; elevated temperature; hypersensitive response; programmed cell death.


Figures

FIGURE 1
FIGURE 1
ETI-associated hypersensitive response and ion leakage are suppressed by elevated temperature in Arabidopsis accession Col-0. For ambient room temperature (RT) or elevated temperature (ET) conditions, plants were subject to 21–24°C and 30°C, respectively, for 24 h prior to infiltration. (A) Arabidopsis half-leaves were infiltrated with PtoDC3000 (Pto) expressing empty vector (EV), HopZ1a or AvrRpt2 at OD600 = 0.1 (5 × 10⁷ CFU/mL). Hypersensitive response (HR) phenotypes were scored between 10 and 20 h post infiltration (hpi). Fractions indicate number of leaves displaying HR phenotype out of total number of leaves infiltrated. This is also reflected in percentages at the bottom of the figure. Numbers in brackets indicate weak HR phenotypes; asterisks (*) indicate strong HR phenotypes on the images presented. Macroscopic HR assays were performed three times with similar results. (RT = 23.7°C, 47% relative humidity (RH); ET = 30.0°C, 48% RH) (B) Arabidopsis leaves were infiltrated with PtoDC3000 (Pto) expressing empty vector (EV), HopZ1a or AvrRpt2 at OD600 = 0.04 (2 × 10⁷ CFU/mL). Four leaf disks per plant (one disk per leaf, total leaf tissue 1.5 cm2) were transferred to 6 mL of sterile ddH2O and conductivity readings were taken between 10 and 20 hpi (see Materials and Methods). Ion leakage assays were conducted three times with similar results. (RT = 24.6°C, 51% RH; ET = 30.0°C, 50% RH).
FIGURE 2
FIGURE 2
ETI-associated virulence suppression is not inhibited by elevated temperatures. For ambient room temperature (RT) or elevated temperature (ET) conditions, plants were subject to 21–24°C and 30°C, respectively, for 24 h prior to infiltration. (A) Arabidopsis leaves were infiltrated with PtoDC3000 (Pto) expressing empty vector (EV), HopZ1a, or AvrRpt2 at OD600 = 0.0002 (1 × 10⁵ CFU/mL). Bacterial counts were determined 1 h post-infiltration (0 dpi) and 3 days post-infiltration (3 dpi). Two-tailed homoscedastic t-tests were performed to test for significant differences. Treatments were compared to empty vector in either the ambient room temperature (RT) or elevated temperature (ET) condition and significant differences are indicated by an asterisk (*P < 0.01). Error bars indicate the standard deviation from the mean of 2 samples (0 dpi) and 10 samples (3 dpi). Bacterial growth assays for HopZ1a and AvrRpt2 were conducted four times with similar results. (RT = 24.6–25.4°C, 16–26% RH; ET = 30.0°C, 25–26% RH) (B) Arabidopsis plants were spray-inoculated with PtoDC3000 (Pto) expressing empty vector (EV), HopZ1a or AvrRpt2 at OD600 = 0.4 (2 × 10⁸ CFU/mL). Photos shown were taken 10 days post-spraying (dps). Assay was conducted four times with similar results. Scale bar indicates 1 cm. (RT = 22.8–25°C, 48–53% RH; ET = 29.7–30.0°C, 35–50% RH) (C) Arabidopsis accessions Col-0, CIBC-5, Wei-0 and Tsu-1 were spray inoculated with PtoDC3000 (Pto) expressing empty vector (EV) or HopZ1a at OD600 = 0.8 (4 × 10⁸ CFU/mL). Independent Col-0 control plants were grown on same flat as each indicated accession. Photos shown were taken 10 dps. Assay was conducted four times with similar results. Scale bar indicates 1cm. (RT = 22.8–23.7°C, 48–51% RH; ET = 30.0°C, 41–51% RH) (D) Normalized and absolute fresh weight measurements of Arabidopsis accessions Col-0, CIBC-5, Wei-0 and Tsu-1 for untreated plants, and plants treated with Pto (EV) or HopZ1a at 10 dps as in panel (C). Normalized fresh weight values were calculated relative to the respective untreated controls for each temperature and accession assay to account for the greater general growth observed under ET conditions. Absolute fresh weight in milligrams (mg) is shown on the secondary Y-axis. Data are combined from multiple trials. Error bars indicate standard errors. Two-tailed homoscedastic t-tests were performed to test significance and asterisk indicate P-values (0.05 > * > 0.01 > ** > 0.001 > ***).

References

    1. Beattie G. A. (2011). Water relations in the interaction of foliar bacterial pathogens with plants. Annu. Rev. Phytopathol. 49, 533–555. 10.1146/annurev-phyto-073009-114436 - DOI - PubMed
    1. Bent A. F., Kunkel B. N., Dahlbeck D., Brown K. L., Schmidt R., Giraudat J., et al. (1994). RPS2 of Arabidopsis thaliana: a leucine-rich repeat class of plant disease resistance genes. Science 265, 1856–1860. 10.1126/science.8091210 - DOI - PubMed
    1. Cheng C., Gao X., Feng B., Sheen J., Shan L., He P. (2013). Plant immune response to pathogens differs with changing temperatures. Nat. Commun. 4, 2530. 10.1038/ncomms3530 - DOI - PMC - PubMed
    1. Deslandes L., Rivas S. (2012). Catch me if you can: bacterial effectors and plant targets. Trends Plant Sci. 17, 644–655. 10.1016/j.tplants.2012.06.011 - DOI - PubMed
    1. Dodds P. N., Rathjen J. P. (2010). Plant immunity: towards an integrated view of plant-pathogen interactions. Nat. Rev. Genet. 11, 539–548. 10.1038/nrg2812 - DOI - PubMed

LinkOut - more resources