

Prediction using hierarchical data: Applications for automated detection of cervical cancer
- PMID: 26617681
- PMCID: PMC4659436
- DOI: 10.1002/sam.11261
Prediction using hierarchical data: Applications for automated detection of cervical cancer
Abstract
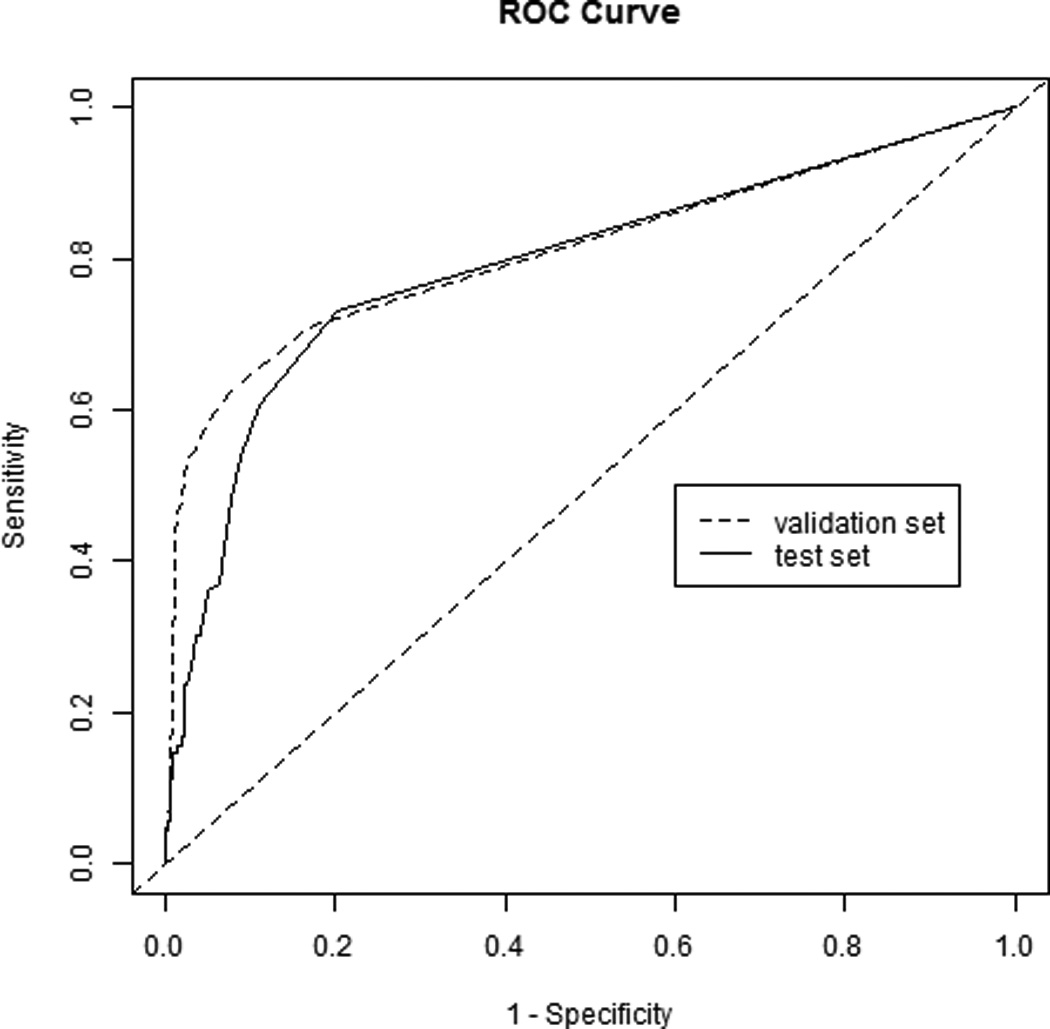
Although the Papanicolaou smear has been successful in decreasing cervical cancer incidence in the developed world, there exist many challenges for implementation in the developing world. Quantitative cytology, a semi-automated method that quantifies cellular image features, is a promising screening test candidate. The nested structure of its data (measurements of multiple cells within a patient) provides challenges to the usual classification problem. Here we perform a comparative study of three main approaches for problems with this general data structure: a) extract patient-level features from the cell-level data; b) use a statistical model that accounts for the hierarchical data structure; and c) classify at the cellular level and use an ad hoc approach to classify at the patient level. We apply these methods to a dataset of 1,728 patients, with an average of 2,600 cells collected per patient and 133 features measured per cell, predicting whether a patient had a positive biopsy result. The best approach we found was to classify at the cellular level and count the number of cells that had a posterior probability greater than a threshold value, with estimated 61% sensitivity and 89% specificity on independent data. Recent statistical learning developments allowed us to achieve high accuracy.
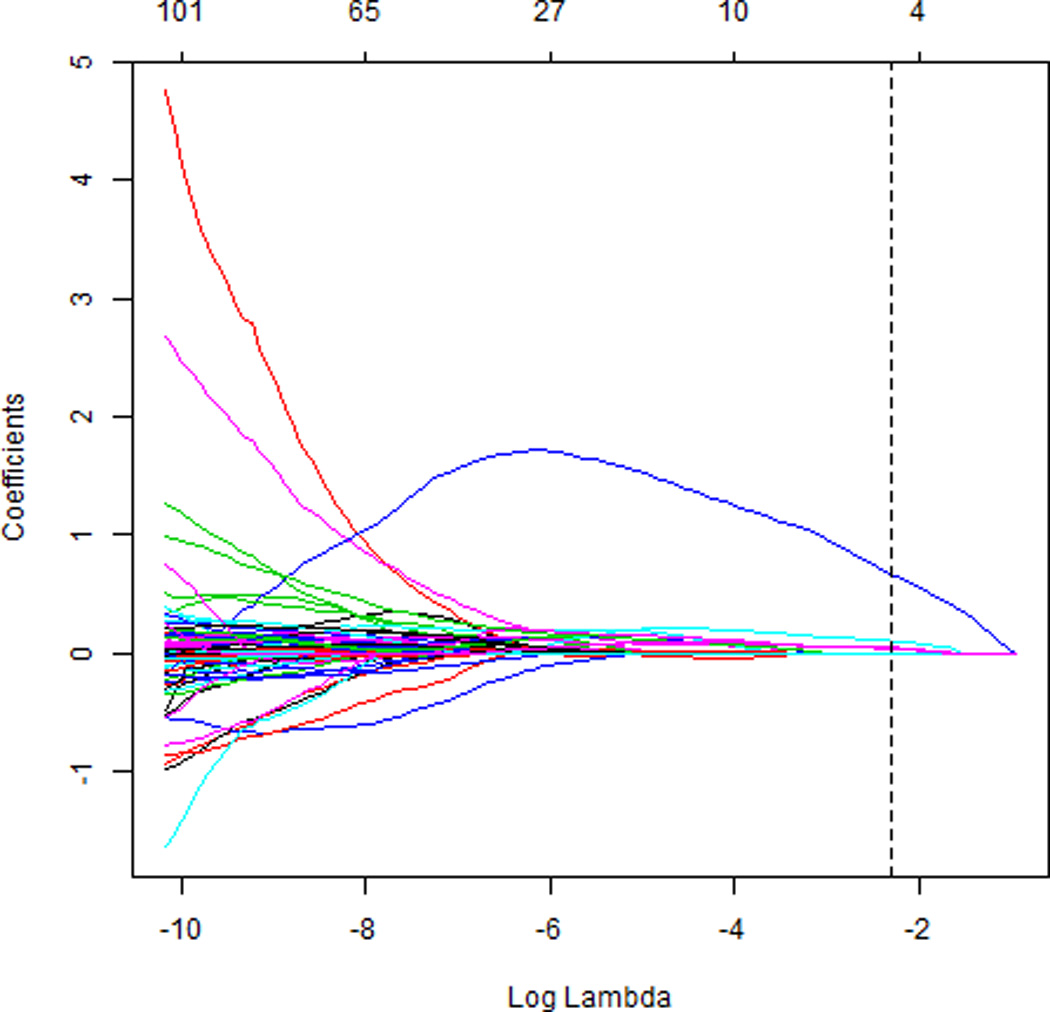
Keywords: DNA ploidy; L1-regularized logistic regression; cross-validation; multilevel classification; quantitative cytology; variable selection.
Figures
References
-
- Mangasarian O, Street W, Wolberg W. Breast cancer diagnosis and prognosis via linear programming. Operations Research. 1995;43:570–577.
-
- Sciubba J. Improving detection of precancerous and cancerous oral lesions. Journal of the American Dental Association. 1999;130:1445–1457. - PubMed
-
- Christian D. Computer-assisted analysis of oral brush biopsies at an oral cancer screening program. Journal of the American Dental Association. 2002;133:357–362. - PubMed
-
- Boutaga K, Savelkoul P, Winkel E, Van Winkelhoff A. Comparison of subgingival bacterial sampling with oral lavage for detection and quantification of periodontal pathogens by real-time polymerase chain reaction. Journal of Periodontology. 2007;78:79–86. - PubMed
-
- Cadez IV, Mclaren CE, Smyth P, Mclachlan GJ. Hierarchical models for screening of iron-deficient anemia. In: Bratko I, Dzeroski S, editors. Proceedings of the 16th International Conference on Machine Learning. San Francisco, CA: Morgan Kaufmann; 1999. pp. 77–86.
Grants and funding
LinkOut - more resources
Full Text Sources
Other Literature Sources