. 2016 Jan;48(1):59-66.
doi: 10.1038/ng.3457. Epub 2015 Nov 30.

Integrated genomic characterization of IDH1-mutant glioma malignant progression

Affiliations

Integrated genomic characterization of IDH1-mutant glioma malignant progression

Hanwen Bai et al. Nat Genet. 2016 Jan.

Abstract

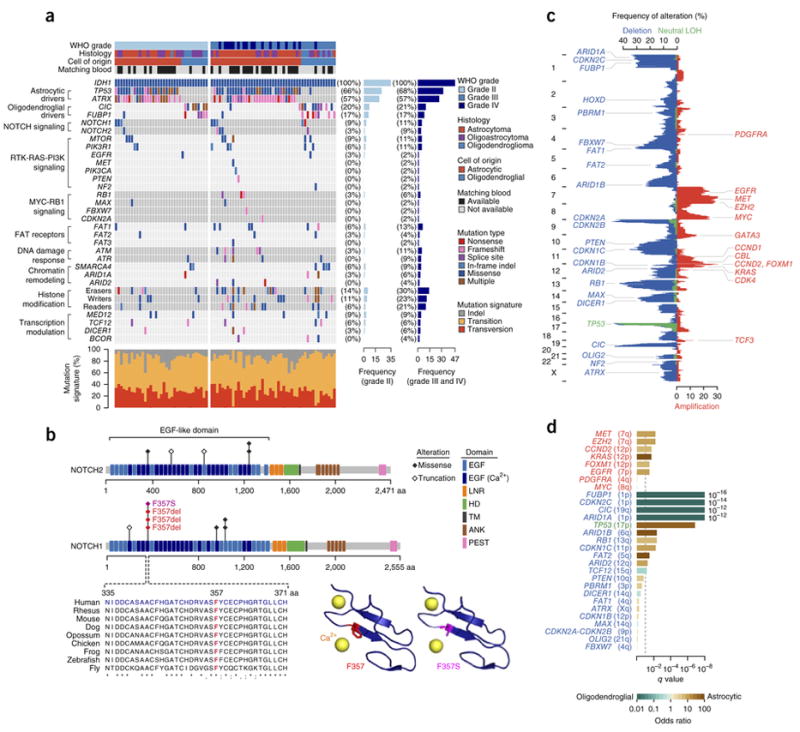
Gliomas represent approximately 30% of all central nervous system tumors and 80% of malignant brain tumors. To understand the molecular mechanisms underlying the malignant progression of low-grade gliomas with mutations in IDH1 (encoding isocitrate dehydrogenase 1), we studied paired tumor samples from 41 patients, comparing higher-grade, progressed samples to their lower-grade counterparts. Integrated genomic analyses, including whole-exome sequencing and copy number, gene expression and DNA methylation profiling, demonstrated nonlinear clonal expansion of the original tumors and identified oncogenic pathways driving progression. These include activation of the MYC and RTK-RAS-PI3K pathways and upregulation of the FOXM1- and E2F2-mediated cell cycle transitions, as well as epigenetic silencing of developmental transcription factor genes bound by Polycomb repressive complex 2 in human embryonic stem cells. Our results not only provide mechanistic insight into the genetic and epigenetic mechanisms driving glioma progression but also identify inhibition of the bromodomain and extraterminal (BET) family as a potential therapeutic approach.


Conflict of interest statement

COMPETING FINANCIAL INTERESTS

The authors declare competing financial interests: details are available in the online version of the paper.

Figures

Figure 1
Figure 1
Genomic landscape of IDH1-mutant gliomas (n = 82 tumors). (a) Recurrently mutated genes. For PIK3R1, PIK3CA, EGFR, MET, NF2 and MAX, only data for known hotspot mutations are plotted. Recurrently mutated genes, which are grouped on the basis of molecular pathways, are shown on the left. Their mutation frequencies in grade II tumors and in grade III and IV tumors are shown on the right. Each tumor’s clinicopathological characteristics are shown at the top, and mutation signatures are indicated at the bottom. (b) Alterations encoded by recurrent mutations in the NOTCH1 and NOTCH2 genes. Protein domains and mutated residues are color-coded and depicted at the top. At the bottom left, multispecies conservation of the Phe357 mutation hotspot in EGF-like domain 9 is shown. At the bottom right, the Phe357 residue is mapped onto a crystal structure of NOTCH1 EGF-like domain 13 (Protein Data Bank (PDB), 2VJ3). The wild-type residue is shown in red, and the p.Phe357Ser missense alteration is shown in magenta. EGF, EGF-like domain; EGF (Ca2+), Ca2+-binding EGF-like domain; LNR, Lin12/Notch repeat; HD, heterodimerization domain; TM, transmembrane domain; ANK, ankyrin repeat; PEST, proline, glutamic acid, serine, threonine–rich degradation motif. (c) Overall pattern of CNAs. The vertical axis represents the genome. The horizontal axis indicates the frequency of chromosomal deletions (blue) or copy-neutral LOH events (green), as well as amplifications (red). Consensus cancer-related genes located within corresponding genomic regions are indicated. (d) Association of CNAs with cell of origin. The horizontal axis represents association significance, calculated using two-sided Fisher’s exact test. The dashed line corresponds to a q value of 0.1. The colored bars represent association odds ratios (green, enriched in oligodendroglial tumors; brown, enriched in astrocytic tumors).
Figure 2
Figure 2
Patterns of nonlinear clonal evolution during glioma progression. (a) The number of protein-altering mutations and percentage of the genome with CNAs specific to the initial or progressed tumor are shown for all 41 patients. Alterations specific to progressed or initial tumors are shown in dark blue (above the horizontal axis) or in gray (below the horizontal axis), respectively. (b) Branched evolution of glioma driver genes during progression. Recurrently mutated driver genes are labeled along the horizontal axis. The vertical axis represents mutation recurrence. Mutations are colored according to whether they are specific to the initial, lower-grade tumor (gray) or the progressed, higher-grade tumor (dark blue) or are shared by the two (light blue). HM, histone modification. (c) Examples of branched clonal evolution during glioma progression. For each patient shown, CNAs in the initial and progressed tumors, as well as changes during progression, are indicated in the top panel (blue, deletion; red, amplification; green, copy-neutral LOH). Each point in the bottom panel represents a coding mutation. The horizontal and vertical axes represent estimated clonal frequency for each mutation (the fraction of tumor cells carrying the mutation) in the initial and progressed tumors, respectively. Oncogenic driver mutations are color-coded.
Figure 3
Figure 3
Genomic changes during malignant progression of IDH1-mutant gliomas (n = 41 tumor pairs). (a) Genes that acquired mutations during progression, which are grouped according to molecular pathways, are shown on the left. Mutation frequencies are shown on the right. Each tumor’s clinicopathological characteristics are shown at the top. (b) Overall pattern of CNAs during malignant progression. The vertical axis represents the genome. The horizontal axis indicates the frequency of chromosomal deletions (blue), copy-neutral LOH events (green) and amplifications (red) during progression. Consensus cancer-related genes located within corresponding genomic regions are indicated. (c) Association of CNAs with glioma progression. The horizontal axis represents the significance of association, calculated using conditional logistic regression and likelihood-ratio test. The dashed line corresponds to a q value of 0.1.
Figure 4
Figure 4
Gene expression during glioma progression (n = 28 tumor pairs). (a) GSEA of transcriptional changes during progression. Significantly enriched gene sets (empirical P < 0.05 and false discovery rate (FDR) < 0.05) are labeled and colored according to their normalized enrichment scores. (b) Differential gene expression during progression. A volcano plot comparing gene expression in progressed versus paired initial tumors is shown on the top. Significantly upregulated genes are colored in red, whereas significantly downregulated genes are colored in blue. q values were calculated using paired two-sided moderated Student’s t test. Functional enrichments of differentially expressed genes are shown at the bottom. Enrichment q values were calculated by hypergeometric test.
Figure 5
Figure 5
DNA methylation during glioma progression. (a) Differential DNA methylation during progression (n = 24 tumor pairs). A volcano plot comparing DNA methylation in progressed versus paired initial tumors is shown on the left. Significantly hypermethylated CpG sites are colored in magenta, whereas significantly hypomethylated CpG sites are colored in green. q values were calculated using paired two-sided moderated Student’s t test. Genomic region enrichment analysis of differentially methylated CpGs is shown on the right. Enrichment q values were calculated by hypergeometric test. Gene sets marked with an asterisk and colored in blue are enriched not only in hypermethylated CpGs but also in transcriptionally downregulated genes during progression. (b) Aggregation of hESC ChIP-seq signals around DNA methylation sites. Shown are average H3K27me3, EZH2 and SUZ12 ChIP-seq signals in hESCs near hypermethylated (magenta), hypomethylated (green) and remaining (gray) CpG sites during glioma progression. (c) Schematics depicting aberrant PRC2–DNA methyltransferases (DNMT) crosstalk during glioma progression. Me, methyl group. (d) Fold change in EZH2 expression during progression (n = 28 tumor pairs). The q value is from the differential gene expression analysis, calculated by paired two-sided moderated Student’s t test.
Figure 6
Figure 6
Oncogenic networks during glioma progression and response to BET inhibition. (a) The oncogenic pathways driving glioma progression are summarized. Major functional pathways and their components affected by gene mutation, CNA, or alterations in RNA expression or DNA methylation are depicted. (b) Association of oncogenic pathways with glioma progression. The horizontal axis represents association significance, calculated using conditional logistic regression and likelihood-ratio test. The dashed line corresponds to a q value of 0.1. (c) Therapeutic inhibition of IDH1-mutant glioma cell growth. Shown are 72- or 120-h survival curves of patient-derived IDH1-mutant glioma primary cell cultures (TM-61 and TM-74) as well as an established cell line (TS-603) after treating with BET inhibitors or TMZ. All cells were treated with compounds for 72 h unless otherwise specified. Error bars represent s.e.m., calculated over four replicates per compound per dosage. BETi-JQ1, BET inhibitor JQ1; BETi-GS, BET inhibitor GS-626510; TMZ, temozolomide.

References

    1. Ostrom QT, et al. CBTRUS statistical report: primary brain and central nervous system tumors diagnosed in the United States in 2007–2011. Neuro-oncol. 2014;16(suppl. 4):iv1–iv63. - PMC - PubMed
    1. Louis DN, et al. The 2007 WHO classification of tumours of the central nervous system. Acta Neuropathol. 2007;114:97–109. - PMC - PubMed
    1. Claus EB, Black PM. Survival rates and patterns of care for patients diagnosed with supratentorial low-grade gliomas. Cancer. 2006;106:1358–1363. - PubMed
    1. Stupp R, et al. Radiotherapy plus concomitant and adjuvant temozolomide for glioblastoma. N Engl J Med. 2005;352:987–996. - PubMed
    1. Stupp R, et al. Effects of radiotherapy with concomitant and adjuvant temozolomide versus radiotherapy alone on survival in glioblastoma in a randomised phase III study: 5-year analysis of the EORTC-NCIC trial. Lancet Oncol. 2009;10:459–466. - PubMed

Publication types

MeSH terms