

Heterogeneity of Regional Brain Atrophy Patterns Associated with Distinct Progression Rates in Alzheimer's Disease
- PMID: 26618360
- PMCID: PMC4664412
- DOI: 10.1371/journal.pone.0142756
Heterogeneity of Regional Brain Atrophy Patterns Associated with Distinct Progression Rates in Alzheimer's Disease
Abstract
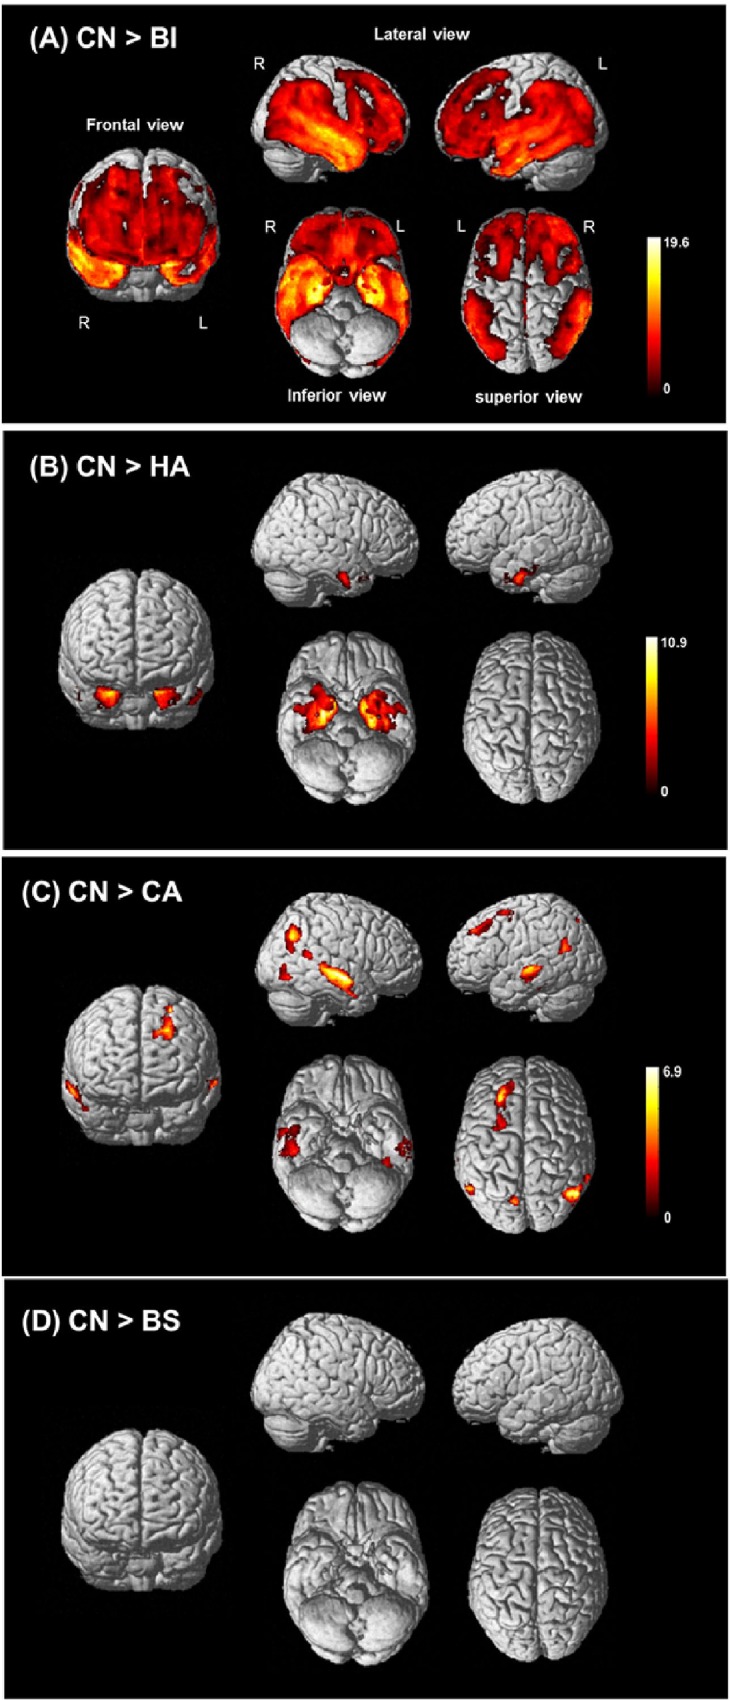
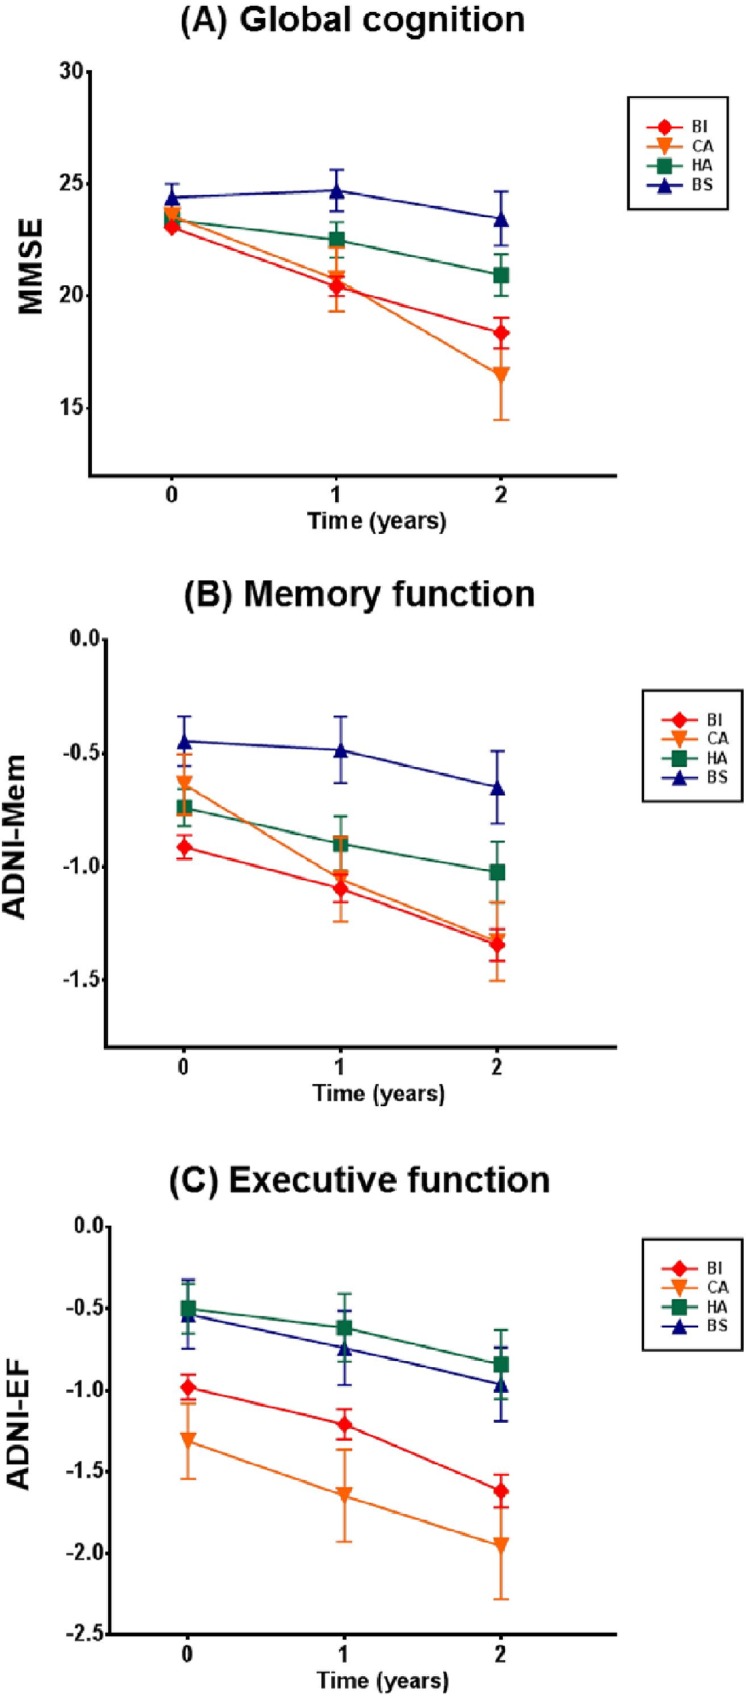
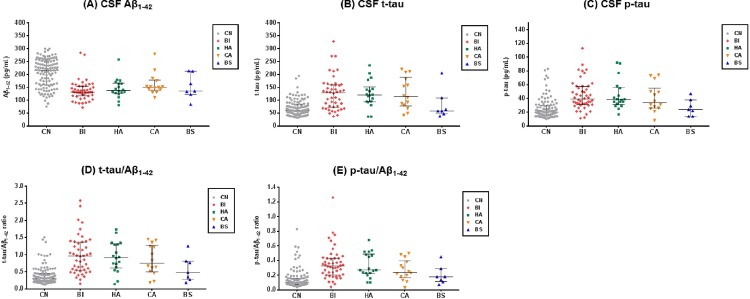
We aimed to identify and characterize subtypes of Alzheimer's disease (AD) exhibiting different patterns of regional brain atrophy on MRI using age- and gender-specific norms of regional brain volumes. AD subjects included in the Alzheimer's Disease Neuroimaging Initiative study were classified into subtypes based on standardized values (Z-scores) of hippocampal and regional cortical volumes on MRI with reference to age- and gender-specific norms obtained from 222 cognitively normal (CN) subjects. Baseline and longitudinal changes of clinical characteristics over 2 years were compared across subtypes. Whole-brain-level gray matter (GM) atrophy pattern using voxel-based morphometry (VBM) and cerebrospinal fluid (CSF) biomarkers of the subtypes were also investigated. Of 163 AD subjects, 58.9% were classified as the "both impaired" subtype with the typical hippocampal and cortical atrophy pattern, whereas 41.1% were classified as the subtypes with atypical atrophy patterns: "hippocampal atrophy only" (19.0%), "cortical atrophy only" (11.7%), and "both spared" (10.4%). Voxel-based morphometric analysis demonstrated whole-brain-level differences in overall GM atrophy across the subtypes. These subtypes showed different progression rates over 2 years; and all subtypes had significantly lower CSF amyloid-β 1-42 levels compared to CN. In conclusion, we identified four AD subtypes exhibiting heterogeneous atrophy patterns on MRI with different progression rates after controlling the effects of aging and gender on atrophy with normative information. CSF biomarker analysis suggests the presence of Aβ neuropathology irrespective of subtypes. Such heterogeneity of MRI-based neuronal injury biomarker and related heterogeneous progression patterns should be considered in clinical trials and practice with AD patients.
Conflict of interest statement
Figures
References
-
- McKhann G, Drachman D, Folstein M, Katzman R, Price D, Stadlan EM. Clinical diagnosis of Alzheimer's disease: report of the NINCDS-ADRDA Work Group under the auspices of Department of Health and Human Services Task Force on Alzheimer's Disease. Neurology. 1984;34(7):939–44. - PubMed
-
- Jack CR Jr., Albert MS, Knopman DS, McKhann GM, Sperling RA, Carrillo MC, et al. Introduction to the recommendations from the National Institute on Aging-Alzheimer's Association workgroups on diagnostic guidelines for Alzheimer's disease. Alzheimer's & dementia: the journal of the Alzheimer's Association. 2011;7(3):257–62. 10.1016/j.jalz.2011.03.004 - DOI - PMC - PubMed
-
- McKhann GM, Knopman DS, Chertkow H, Hyman BT, Jack CR Jr., Kawas CH, et al. The diagnosis of dementia due to Alzheimer's disease: recommendations from the National Institute on Aging-Alzheimer's Association workgroups on diagnostic guidelines for Alzheimer's disease. Alzheimer's & dementia: the journal of the Alzheimer's Association. 2011;7(3):263–9. 10.1016/j.jalz.2011.03.005 - DOI - PMC - PubMed
Publication types
MeSH terms
Grants and funding
LinkOut - more resources
Full Text Sources
Other Literature Sources
Medical
