. 2015 Nov 30;13(11):e1002305.
doi: 10.1371/journal.pbio.1002305. eCollection 2015.

Mapping the Free Energy Landscape of PKA Inhibition and Activation: A Double-Conformational Selection Model for the Tandem cAMP-Binding Domains of PKA RIα

Affiliations

Mapping the Free Energy Landscape of PKA Inhibition and Activation: A Double-Conformational Selection Model for the Tandem cAMP-Binding Domains of PKA RIα

Madoka Akimoto et al. PLoS Biol. .

Abstract

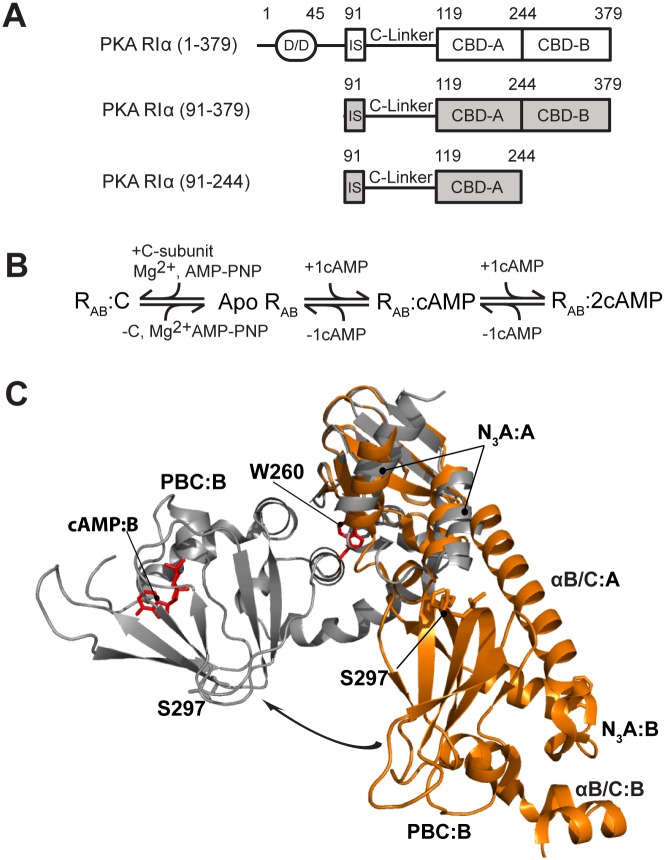
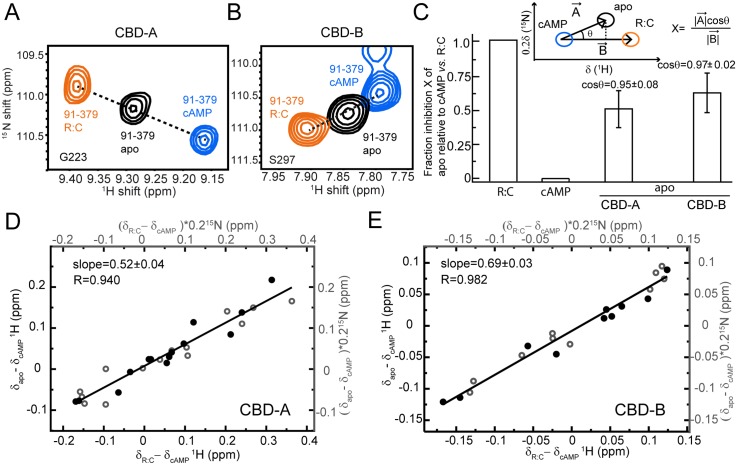
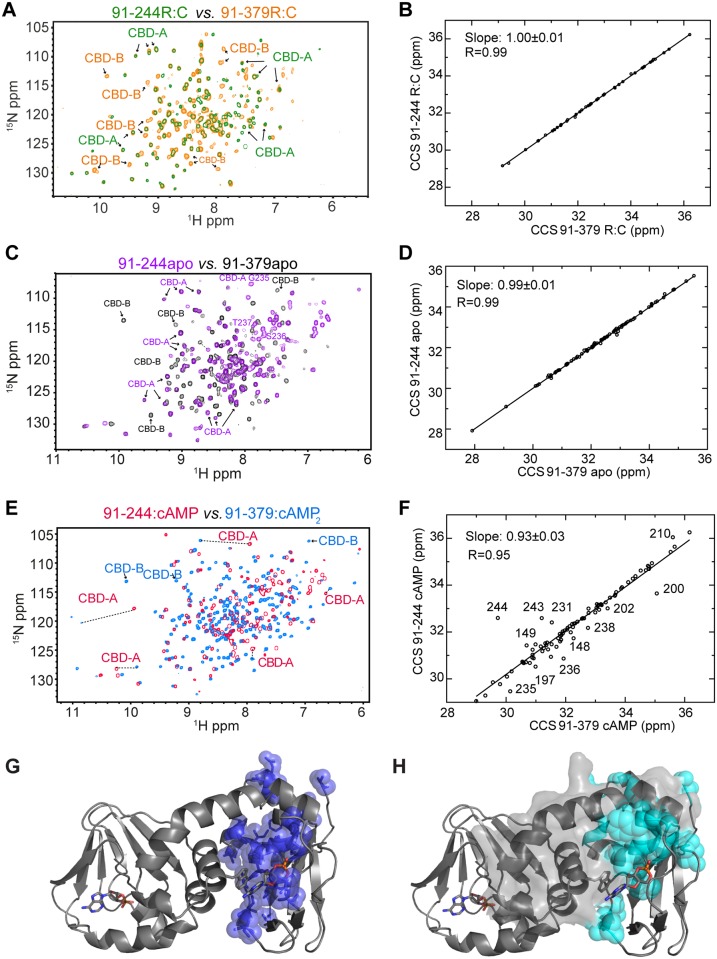
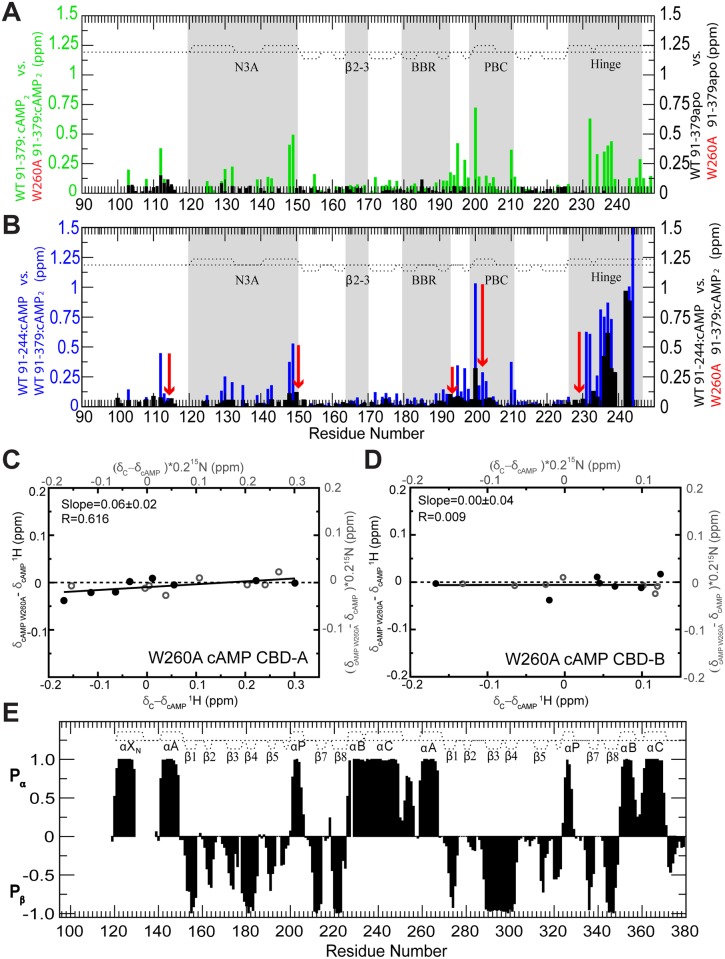
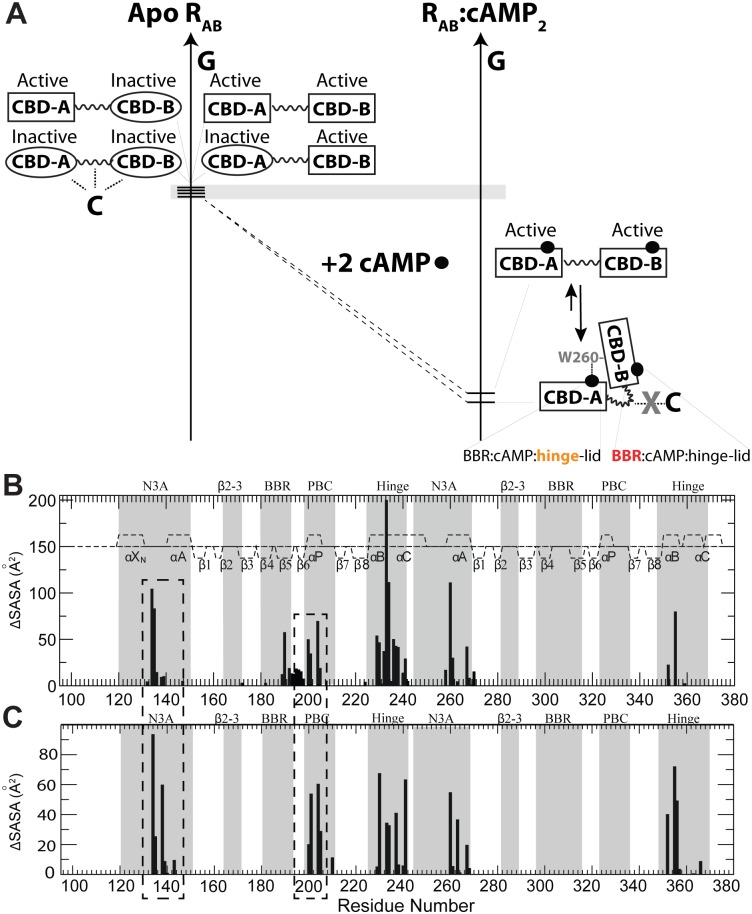
Protein Kinase A (PKA) is the major receptor for the cyclic adenosine monophosphate (cAMP) secondary messenger in eukaryotes. cAMP binds to two tandem cAMP-binding domains (CBD-A and -B) within the regulatory subunit of PKA (R), unleashing the activity of the catalytic subunit (C). While CBD-A in RIα is required for PKA inhibition and activation, CBD-B functions as a "gatekeeper" domain that modulates the control exerted by CBD-A. Preliminary evidence suggests that CBD-B dynamics are critical for its gatekeeper function. To test this hypothesis, here we investigate by Nuclear Magnetic Resonance (NMR) the two-domain construct RIα (91-379) in its apo, cAMP2, and C-bound forms. Our comparative NMR analyses lead to a double conformational selection model in which each apo CBD dynamically samples both active and inactive states independently of the adjacent CBD within a nearly degenerate free energy landscape. Such degeneracy is critical to explain the sensitivity of CBD-B to weak interactions with C and its high affinity for cAMP. Binding of cAMP eliminates this degeneracy, as it selectively stabilizes the active conformation within each CBD and inter-CBD contacts, which require both cAMP and W260. The latter is contributed by CBD-B and mediates capping of the cAMP bound to CBD-A. The inter-CBD interface is dispensable for intra-CBD conformational selection, but is indispensable for full activation of PKA as it occludes C-subunit recognition sites within CBD-A. In addition, the two structurally homologous cAMP-bound CBDs exhibit marked differences in their residual dynamics profiles, supporting the notion that conservation of structure does not necessarily imply conservation of dynamics.


Conflict of interest statement

The authors have declared that no competing interests exist.

Figures

Fig 1
Fig 1. Construct design and architecture of PKA RIα.
(A) Domain organization of the RIα subunit of PKA and its functional constructs that ensure cAMP-dependent inhibition of the catalytic subunit (C). (B) Binding equilibria of PKA RIα. Even when apo RIα is a transient low-population intermediate, it is still a critical thermodynamic determinant of the cAMP-dependent regulation of PKA. (C) Structures of PKA RIα (91–379) bound to either cAMP (grey, PDB code 1RGS) or the C-subunit (orange, PDB code 2QCS for the R333K mutant of RIα (91–379)). The two structures are superimposed through the β-barrel of cAMP-binding domain (CBD) A. Selected regions and residues are labeled. The arrow shows the change in the position of CBD-B relative to CBD-A occurring upon cAMP-binding.
Fig 2
Fig 2. Conformational selection in CBD-A and -B of RIα (91–379).
(A, B) Overlay of apo, cAMP2-bound, and C-bound RIα (91–379) for cross-peaks of representative residues sensing the active versus inactive equilibria in CBD-A (A) and CBD-B (B). (C) Fractional inhibition of apo RIα (91–379) (X) relative to cAMP2- and C-bound RIα (91–379), assuming they represent the active and inactive forms of PKA, respectively. The inset illustrates how X was measured using the CHEmical Shift Projection Analysis (CHESPA) method. The bar graph shows the average X values observed for residues in CBD-A and -B exhibiting a linear pattern (|cosθ| > 0.95). (D) Alternative evaluation of the fractional inhibition of apo RIα (91–379) (X) through the slope of the (δapo−δcAMP) versus (δC−δcAMP) plot, where δapo, δcAMP, and δC are the chemical shifts of apo, cAMP2- and C-bound RIα (91–379). Closed and open circles indicate 1H and 15N chemical shifts, respectively. This plot was restricted to CBD-A residues that are sufficiently removed from the cAMP-dependent interfaces (e.g., R:C, R:cAMP and CBD-A:CBD-B) to report primarily on the active versus inactive equilibrium of CBD-A. (E) Similar to panel (D) but for CBD-B.
Fig 3
Fig 3. Probing CBD-A/B interactions in apo, C-bound, and cAMP2-bound RIα (91–379) through CBD-B deletion.
(A) Overlay of the HN-TROSY spectra of C-bound RIα (91–379) and RIα (91–244), in which CBD-B is deleted. (B) Correlation between the combined chemical shifts (CCS) of C-bound RIα (91–379) and RIα (91–244). (C, D) As in panels (A, B), but for the apo forms of RIα (91–379) and RIα (91–244). (E, F) As in panels (A, B), but for the cAMP2-bound form of RIα (91–379) and the cAMP-bound form of RIα (91–244). Color codes for panels A, C, and E are indicated in the figure and representative CBD-A and -B cross-peaks are labeled. (G) Map of above-average RIα (91–379):cAMP2 versus RIα (91–244):cAMP CCS differences for residues <226 (blue spheres) onto the structure of RIα (91–379):cAMP2 (PDB Code: 1RGS). (H) Cyan spheres represent CBD-A residues experiencing solvent accessible surface area (SASA) changes upon deletion of residues 226–379, which are highlighted with a grey surface. This SASA map was built using the same structure as in panel (G).
Fig 4
Fig 4. Probing CBD-A/B interactions in RIα (91–379) through the W260A mutation.
Evaluation of the effect of the W260A mutation on the CBD-A/B interface through CCS differences in the apo and cAMP-bound states. (A) CCS changes caused by the W260A mutation in RIα (91–379) apo (black) or cAMP2-bound (green). (B) Plot of WT cAMP-bound RIα (91–244) versus WT cAMP2-bound RIα (91–379) CCS differences (blue) and plot of the WT cAMP-bound RIα (91–244) versus W260A cAMP2-bound RIα (91–379) CCS differences (black). The red arrows illustrate the effect of the W260A mutation. The comparison of the black and blue CCS difference profiles shows that the W260A mutation mimics the deletion of CBD-B. (C) Effect of the W260A mutation on the active versus inactive equilibrium of CBD-A, as assessed by chemical shift correlations, similarly to Fig 2D but with apo WT RIα (91–379) replaced by cAMP2-bound W260A RIα (91–379). (D) As in panel (C), but for CBD-B. (E) 2ary structure probability map based on the secondary chemical shifts of the W260A mutant RIα (119–379):cAMP2 (black bars). The 2ary structure profile of the WT:cAMP2 construct is reported as dotted lines.
Fig 5
Fig 5. Intra- and inter-domain RIα dynamics.
Dynamics of WT (black closed circles) and W260A (green open circles) RIα (119–379):cAMP2 mapped through residue-specific reduced spectral densities at 0 Hz, ωN, and ωN + ωH frequencies in panels (A–C), respectively. Green vertical arrows in panel (A) mark residues of the helical region between the two β-barrels that are subject to fast H/D exchange (within the dead time) in W260A but not in the WT sample. The reduced spectral densities predicted based on the cAMP2- and C-bound RIα structures in the absence of internal motions are shown in orange and blue, respectively. The PDB codes of the structures used for the reduced spectral densities prediction are reported in the figure. Key regions subject to significant CBD-A versus B differences in dynamic profiles are highlighted in grey and with dashed ovals. The dashed horizontal lines in panels (A, B) indicate the average reduced spectral density values at 0 Hz and at ωN for the WT (black) and W260A (green) constructs.
Fig 6
Fig 6
(A) “Double Conformational Selection” Model proposed for PKA-RIα activation. The inactive and active states of each CBD are represented through ovals and rectangles, respectively. The grey horizontal bar indicates that free energy differences are minimal (i.e., of the order of ~RT). Dotted lines denote interactions with the C-subunit of PKA. cAMP is shown as solid black circles. RAB refers to the PKA-RIα region spanning the two tandem cAMP-binding domains (CBD-A and -B). The cAMP recognition motifs for both CBDs are reported as BBR:cAMP:hinge-lid, where BBR stands for base-binding region. Orange (red) denotes enhanced ms-μs (ps-ns) dynamics. See text in the Discussion for a full explanation. (B) Inter-domain contact profile based on the structure of cAMP2-bound RIα (91–379) (PDB Code: 1RGS) and SASA changes occurring upon deletion of the 113–232 region (for contacts in the 233–376 segment) or the 233–376 region (for contacts in the 113–232 segment). The boundary between the two deleted regions (i.e., residues 232–233) is based on the observation that the 233–244 region is flexible in RIα (91–244):cAMP (46). (C) Profile of RIα (91–379):C contacts as mapped by SASA variations upon deletion of the C-subunit from the structure of the RIα (91–379) R333K:C complex (PDB Code: 2QCS). CBD-A regions experiencing SASA changes in both panels (B) and (C) (i.e., CBD-A residues involved in both CBD-A/B contacts as well as interactions with the C-subunit) are highlighted by dashed boxes.

References

    1. Taylor SS, Kornev AP. Protein kinases: evolution of dynamic regulatory proteins. Trends Biochem Sci. 2011;36: 65–77. 10.1016/j.tibs.2010.09.006 - DOI - PMC - PubMed
    1. Serezani CH, Ballinger MN, Aronoff DM, Peters-Golden M. Cyclic AMP: master regulator of innate immune cell function. Am J Respir Cell Mol Biol. 2008;39: 127–132. 10.1165/rcmb.2008-0091TR - DOI - PMC - PubMed
    1. Stork PJ, Schmitt JM. Crosstalk between cAMP and MAP kinase signaling in the regulation of cell proliferation. Trends Cell Biol. 2002;12: 258–266. - PubMed
    1. Shabb JB. Physiological substrates of cAMP-dependent protein kinase. Chem Rev. 2001;101: 2381–2411. - PubMed
    1. Hanks SK, Hunter T. Protein kinases 6. The eukaryotic protein kinase superfamily: kinase (catalytic) domain structure and classification. FASEB J. 1995;9: 576–596. - PubMed

Publication types

MeSH terms

Substances

LinkOut - more resources