. 2016 Jun;54(6):822-30.
doi: 10.1165/rcmb.2015-0297OC.

Airway CD8(+) T Cells Are Associated with Lung Injury during Infant Viral Respiratory Tract Infection

Affiliations

Airway CD8(+) T Cells Are Associated with Lung Injury during Infant Viral Respiratory Tract Infection

Thomas J Connors et al. Am J Respir Cell Mol Biol. 2016 Jun.

Abstract

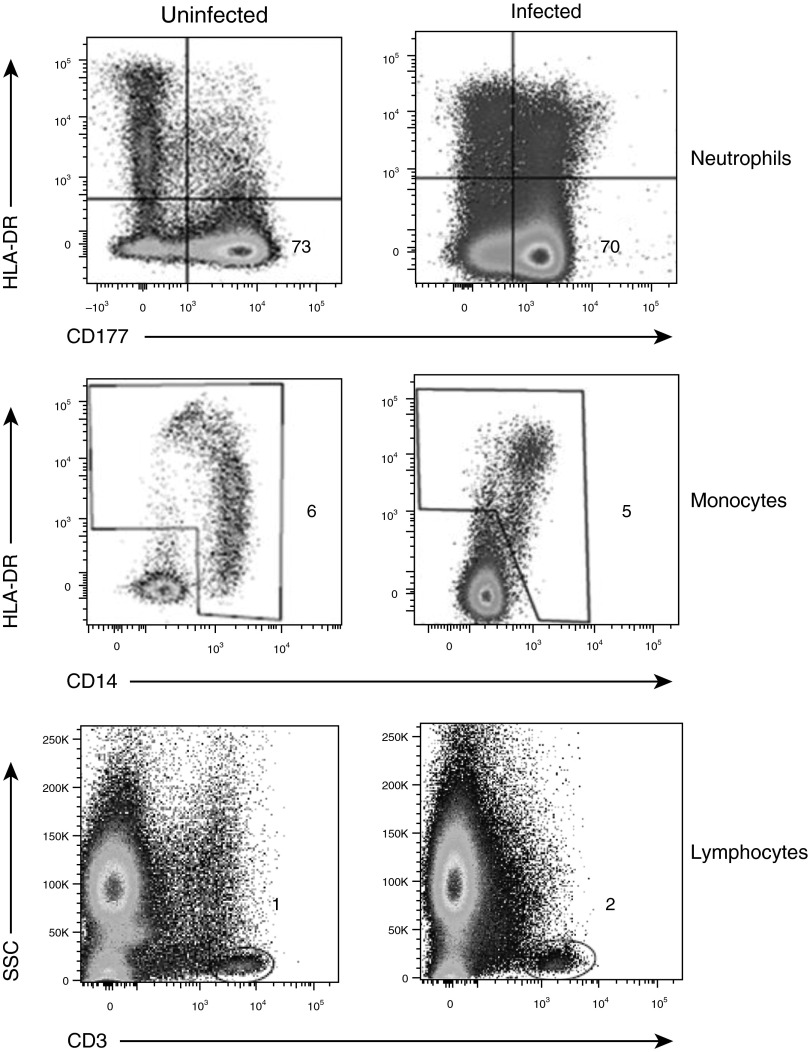
Infants and young children are disproportionately susceptible to severe complications from respiratory viruses, although the underlying mechanisms remain unknown. Recent studies show that the T cell response in the lung is important for protective responses to respiratory infections, although details on the infant/pediatric respiratory immune response remain sparse. The objectives of the present study were to characterize the local versus systemic immune response in infants and young children with respiratory failure from viral respiratory tract infections and its association to disease severity. Daily airway secretions were sampled from infants and children 4 years of age and younger receiving mechanical ventilation owing to respiratory failure from viral infection or noninfectious causes. Samples were examined for immune cell composition and markers of T cell activation. These parameters were then correlated with clinical disease severity. Innate immune cells and total CD3(+) T cells were present in similar proportions in airway aspirates derived from infected and uninfected groups; however, the CD8:CD4 T cell ratio was markedly increased in the airways of patients with viral infection compared with uninfected patients, and specifically in infected infants with acute lung injury. T cells in the airways were phenotypically and functionally distinct from those in blood with activated/memory phenotypes and increased cytotoxic capacity. We identified a significant increase in airway cytotoxic CD8(+) T cells in infants with lung injury from viral respiratory tract infection that was distinct from the T cell profile in circulation and associated with increasing disease severity. Airway sampling could therefore be diagnostically informative for assessing immune responses and lung damage.

Keywords: immunopathology; infant immunity; lung injury; viral pneumonia.


Figures

Figure 1.
Figure 1.
Immune cell composition in airway aspirates. Representative flow cytometry plots from an uninfected (male, 3 mo of age after cardiac surgery, left panel) and an infected patient (female, 2.5 mo with respiratory syncytial virus [RSV] and rhino-/enterovirus coinfection, right panel). The top row shows large cells by HLA-DR (MHC class II molecule) versus CD177 expression; the neutrophil population is denoted by HLA-DR/CD177+, with frequency noted in the lower right quadrant. The middle row shows large cells by HLA-DR versus CD14 expression; monocytes are denoted as HLA-DR+/CD14+, and frequency is shown. The bottom row displays all events by side scatter (SSC) versus CD3 expression; lymphocyte population is gated as SSC low/CD3+, and frequency of CD3+ lymphocytes of total events recorded is shown. CD, cluster of differentiation; HLA-DR, human leukocyte antigen DR.
Figure 2.
Figure 2.
Immune cell composition of aggregated blood and airway samples during study enrollment. Neutrophil (A), monocyte (B), and lymphocyte (C) composition of blood (left) and airway (right) samples from uninfected and infected patients depicted as aggregated data for each day of enrollment. Blood counts (left) derive from 134 complete blood counts sent from 43 enrolled patients as part of routine clinical testing, with the shaded area representing the normal range for that parameter. Airway cellular composition (right) represents aggregated data obtained by flow cytometry analysis of 178 airway aspirates from 53 enrolled patients. Percentage is calculated from the total number of airway cells analyzed. Individual patient characteristics are shown in Table E1.
Figure 3.
Figure 3.
Differential T cell subset composition in blood and airway aspirates between infected and uninfected patients. Representative flow cytometry from an uninfected (left panel) and an infected infant (right panel) also shown in Figure 1. Patients’ samples are divided into two columns, with blood samples on the left and airway aspirates on the right. The top row depicts CD3+ T cells graphed by CD4 versus CD8, with gates applied to CD4+ and CD8+ populations. The middle row displays CD4+ T cells graphed by CD45RO versus CD45RA. The bottom row displays CD8+ T cells graphed by CD45RO versus CD45RA.
Figure 4.
Figure 4.
Airway T cell response by infection status. (A) Peak CD8:CD4 T cell ratio obtained from each uninfected and infected patient over the enrollment period; the bar represents median for group. (B) Peak percentage of CD107+ CD8+ T cells per subject over the enrollment period; the bar represents median for group. (C) Mean CD8:CD4 T cell ratio for each group by enrollment day; error bars indicate ±SEM. Data are derived from 178 airway aspirates from 53 patients, and P values were obtained by Mann-Whitney comparison of medians.
Figure 5.
Figure 5.
Peak CD8:CD4 ratio in airway associated with acute lung injury (ALI). Peak CD8:CD4 T cell ratio obtained from each subject over the enrollment period grouped by infection status and presence of ALI; the bar represents median for group (black plus symbols, uninfected, no ALI; green squares, uninfected + ALI; purple circles, infected, no ALI; red triangles, infected + ALI). P value obtained by Mann-Whitney comparison of medians.
Figure 6.
Figure 6.
Elevated IL-6 in airway samples of infected patients is associated with severity of lung injury. Airway samples were analyzed for cytokine content by Luminex. (A) Scatter plot of IL-6 concentrations measured in airway aspirates of infected patients by day of study enrollment, grouped by presence of ALI. (B) Scatter plot of IFN-γ concentration measured in airway aspirates of infected patients by day of study enrollment, grouped by presence of acute lung injury. (C) Graph illustrates the inverse relation between minimum arterial oxygen pressure/fraction of inspired oxygen (PF) ratio and average IL-6 in logarithmic terms, shown by the negative slopes of the regression lines. The solid line portrays the relation for infected patients at the median value of immune response (median per diem area under the curve of the CD8:CD4 ratio). The two dashed lines fit the relation for patients at the upper quartile of immune response (bottom line) and at the lower quartile (top line). All lines assume age fixed at the mean age among the infected patients.
Figure 7.
Figure 7.
Increased CD8:CD4 ratio in airways is associated with ALI. Per diem area under curve statistical model. Graph depicts the log adjusted per diem area under the curve for CD8:CD4 T cell ratio on the y-axis versus age on the x-axis (black plus symbols, uninfected, no ALI; green squares, uninfected + ALI; purple circles, infected, no ALI; red triangles, infected + ALI). Patients were grouped based on infection status and presence of ALI, similar to Figure 5. Best fit line applied to each group is shown.

References

    1. Tregoning JS, Schwarze J. Respiratory viral infections in infants: causes, clinical symptoms, virology, and immunology. Clin Microbiol Rev. 2010;23:74–98. - PMC - PubMed
    1. Pavia AT. Viral infections of the lower respiratory tract: old viruses, new viruses, and the role of diagnosis. Clin Infect Dis. 2011;52:S284–S289. - PMC - PubMed
    1. Spaeder MC, Custer JW, Bembea MM, Aganga DO, Song X, Scafidi S. A multicenter outcomes analysis of children with severe viral respiratory infection due to human metapneumovirus. Pediatr Crit Care Med. 2013;14:268–272. - PubMed
    1. Levy O. Innate immunity of the newborn: basic mechanisms and clinical correlates. Nat Rev Immunol. 2007;7:379–390. - PubMed
    1. Gervassi AL, Horton H. Is infant immunity actively suppressed or immature? Virology (Auckl) 2014;2014:1–9. - PMC - PubMed

Publication types

MeSH terms