. 2016 Jan;22(1):105-13.
doi: 10.1038/nm.3984. Epub 2015 Nov 30.

Pan-cancer analysis of the extent and consequences of intratumor heterogeneity

Affiliations

Pan-cancer analysis of the extent and consequences of intratumor heterogeneity

Noemi Andor et al. Nat Med. 2016 Jan.

Abstract

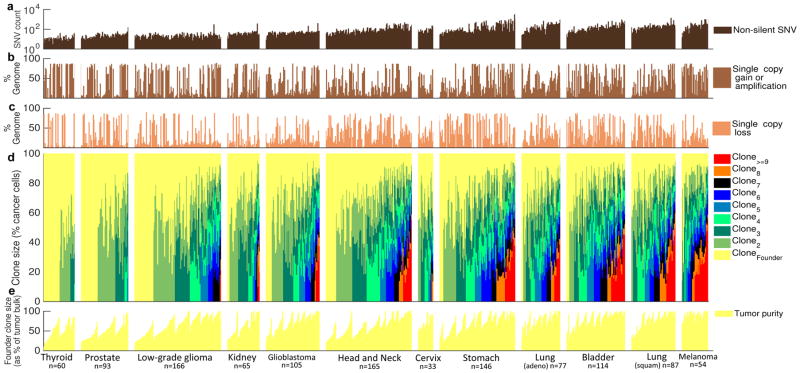
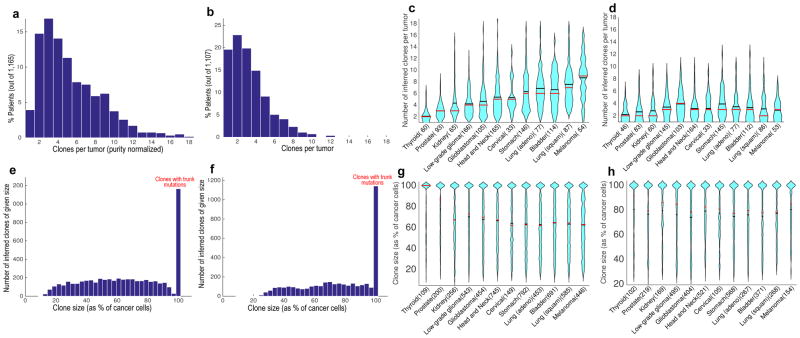
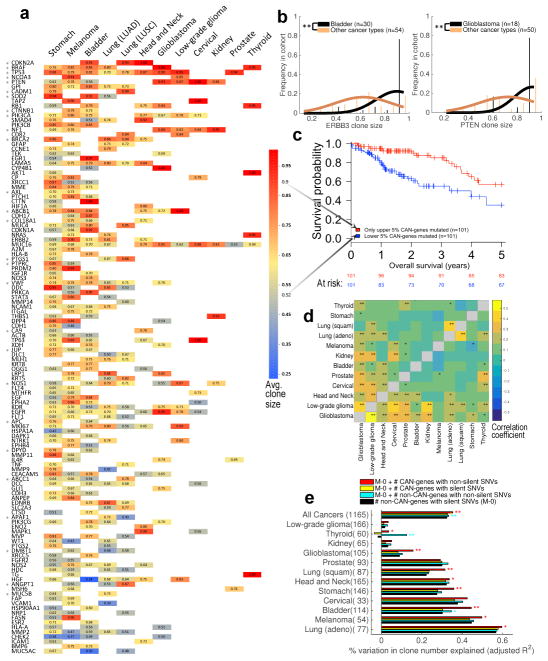
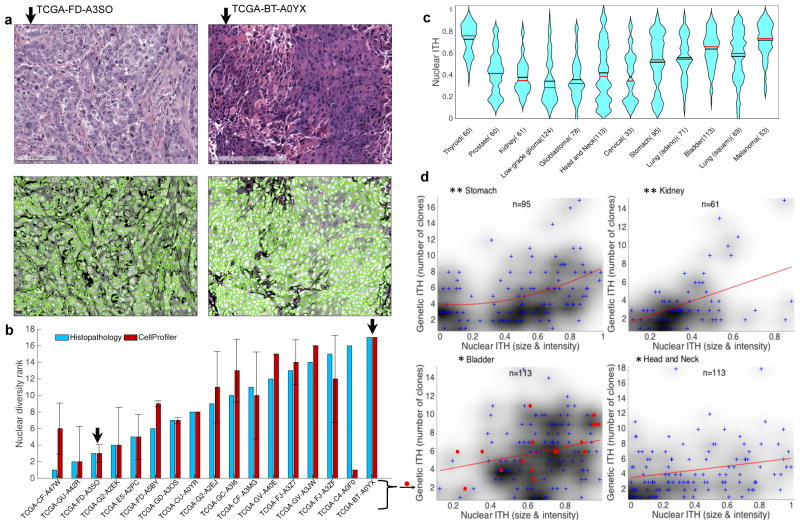
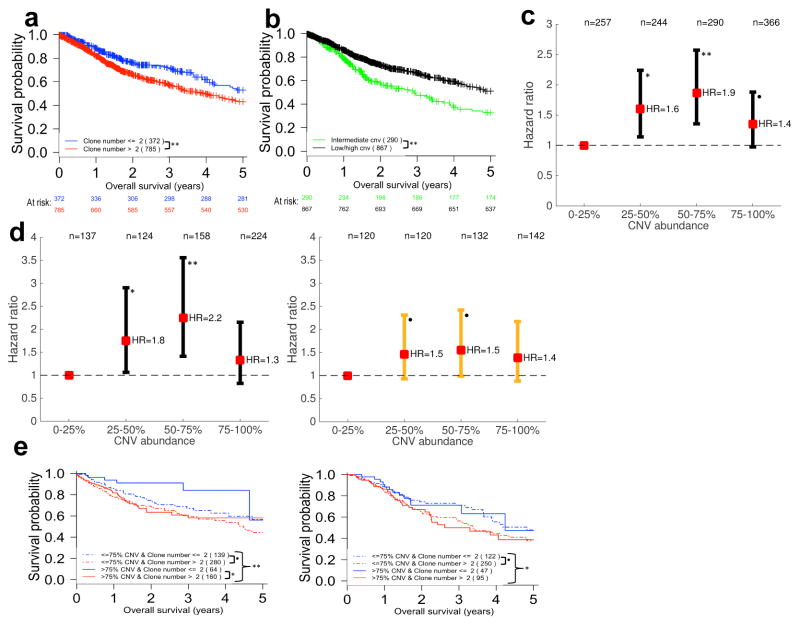
Intratumor heterogeneity (ITH) drives neoplastic progression and therapeutic resistance. We used the bioinformatics tools 'expanding ploidy and allele frequency on nested subpopulations' (EXPANDS) and PyClone to detect clones that are present at a ≥10% frequency in 1,165 exome sequences from tumors in The Cancer Genome Atlas. 86% of tumors across 12 cancer types had at least two clones. ITH in the morphology of nuclei was associated with genetic ITH (Spearman's correlation coefficient, ρ = 0.24-0.41; P < 0.001). Mutation of a driver gene that typically appears in smaller clones was a survival risk factor (hazard ratio (HR) = 2.15, 95% confidence interval (CI): 1.71-2.69). The risk of mortality also increased when >2 clones coexisted in the same tumor sample (HR = 1.49, 95% CI: 1.20-1.87). In two independent data sets, copy-number alterations affecting either <25% or >75% of a tumor's genome predicted reduced risk (HR = 0.15, 95% CI: 0.08-0.29). Mortality risk also declined when >4 clones coexisted in the sample, suggesting a trade-off between the costs and benefits of genomic instability. ITH and genomic instability thus have the potential to be useful measures that can universally be applied to all cancers.


Conflict of interest statement

COMPETING FINANCIAL INTERESTS

The authors declare no competing financial interests.

Figures

Figure 1
Figure 1. Tumor-metagenomes and subclonal genomes in 12 tumor types from TCGA
(a) Prevalence of non-silent somatic SNVs per tumor. Percentage of tumor-metagenome affected by (b) single copy gains/amplifications and (c) single copy losses. (d) Clonal composition inferred from SNVs and copy numbers. Every sample contains a founder tumor population (yellow), identified as the largest clone within the sample. Each change in color marks the presence of an additional clone at the indicated size, calculated as % of the founder population size (y-axis). Color-variety within each tumor-type panel reflects the extent of intra-tumor heterogeneity in the corresponding tumor type. The average number of detectable (>10% frequency) clones increases from thyroid carcinoma (left) to melanoma (right). (e) The size of the founder clone is a measure of tumor purity. The exact number of tumors of each type (n) is indicated at the bottom of each panel.
Figure 2
Figure 2. Intra-tumor genetic heterogeneity in 12 tumor types
Clone number distribution predicted by EXPANDS (a) and PyClone (b) across tumor types. Violin plots of clone number distribution predicted by EXPANDS (c) and PyClone (d) within tumor types. Clone size distribution predicted by EXPANDS (e) and PyClone (f) across tumor types. Violin plots of clone size distribution predicted by EXPANDS (g) and PyClone (h) within tumor types. EXPANDS derived clone numbers (a, c) and all clone sizes (e-h) have been normalized by tumor purity. For PyClone derived clone numbers, normalization by tumor purity was not necessary. Violin plots contain marks for the mean (black lines) and median (red lines). [Thyroid = Thyroid Carcinoma; Prostate = Prostate Adenocarcinoma; Kidney = Kidney Renal Clear Cell Carcinoma; Head and Neck = Head and Neck Squamous Cell Carcinoma; Cervical = Cervical Squamous Cell Carcinoma and Endocervical Adenocarcinoma; Stomach = Stomach Adenocarcinoma; Lung (adeno) = Lung Adenocarcinoma; Bladder = Bladder Urothelial Carcinoma; Lung (squam) = Lung Squamous Cell Carcinoma; Melanoma = Skin Cutaneous Melanoma].
Figure 3
Figure 3. Association of driver gene mutations to clone size and clone number
(a) Clone sizes were predicted by EXPANDS for mutations in 124 CAN-genes and normalized by purity. For each cancer type CAN (x-axis) and gene G (y-axis), average clone size was calculated across all CAN clones that harbor non-silent SNVs in G. Blank entries denote that G was not significantly associated to CAN. SNVs in CAN-genes often have the tendency to occur in clones of characteristic sizes, independent of cancer type (one-sided t-test: *P<0.05). (b) Mutations in some CAN-genes tend to drive large clonal expansions in certain cancer types, for example ERBB3 mutations in bladder carinoma and PTEN mutations in Glioblastoma (one-sided t-test: **P<1E–4). (c) SNVs in CAN-genes that characteristically grew to smaller clones predicts poor prognosis across tumor types (Log-rank test: P=2.9E–4; HR=2.72). (d) Clones with CAN-gene mutations have similar sizes across certain tumor types, suggesting the order/selective advantage of CAN-gene mutations is often not tissue-specific. Pairwise similarity between tumor types is calculated as Spearman correlation (**P<0.01; *P<0.05) based on EXPANDS (above diagonal) and PyClone results (below diagonal). (e) The number of clones identified in a sample depends on SNV incidence, but not all SNV categories are equally associated with the resulting number of clones. Non-silent SNV incidence in CAN-genes (red; mean = 2 genes) explain variability in clone number better than silent SNV incidence in CAN-genes (yellow; mean = 1 gene) or non-silent SNV incidence in non-CAN-genes (cyan; mean =128 genes). Log-likelihood test: **P<0.01; *P<0.05.
Figure 4
Figure 4. Intra-tumor nuclear diversity accompanies intra-tumor genetic diversity
(a) Quantitation of intra-tumoral nuclear diversity from H&E images. Conventional H&E stainings (upper panels) of two bladder cancer specimens are shown. The lesion on the left (TCGA-GD- A3SO) demonstrates monomorphic high-grade nuclei with open chromatin and prominent nucleoli, while the lesion on the right (TCGA-BT-A0YX) demonstrates nuclei that vary from small with condensed chromatin to very large with open chromatin (anisochromasia). CellProfiler outlines nuclei (lower panels) and quantifies nuclear variability from the H&E images. (b) Quantitation of nuclear diversity is shown for the two bladder cancer specimens in panel a (black arrows) along with 15 other bladder cancer specimens. Independent ranking of intra-tumor nuclear diversity across these 17 bladder cancer specimens by an expert histopathologist (blue) validates the automated nuclear diversity measures (red) (ρ=0.64; P=0.007). (c) Violin plots of nuclear diversity within tumor types. Nuclear diversity was normalized to account for differences in tumor purity. Tumor types are ordered according to their extent of genetic ITH (Fig. 2b). (d) Nuclear diversity per tumor (x-axis; quantified based on nuclear intensity and size diversity) increases with increasing clone number per tumor (y-axis). This is true for all cancers combined (ρ=0.243; P=6.30E–14) as well as for the specific types shown (* ρ>0.25; P<0.01; ** ρ>0.4; P<0.001). The p-values shown here have not been corrected for multiple hypothesis testing.
Figure 5
Figure 5. Clone number and CNV burden appear to be universal prognostic biomarkers
(a) The presence of more than two clones detected by EXPANDS in a tumor sample predicts poor overall survival across all 12 tumor types (HR=1.497). (b) Survival curves are stratified by the fraction of the tumor-metagenome affected by CNVs (CNV abundance) across 12 tumor types. Intermediate levels of CNV abundance predict poor outcome (HR=0.597). (c) Hazard ratios as a function of CNV abundance. The hazard ratio for each of the upper three CNV abundance quartiles is calculated relative to the hazard of individuals in the lowest quartile (0–25% CNV abundance) and displayed along with 95% confidence interval. (d) Individuals treated with chemo- or radiotherapy (right panel) and untreated individuals (left panel) are stratified by CNV abundance. Individuals with low (<25%) or high CNV abundance (>75%) progress more slowly than individuals with intermediate CNV abundance levels (25–75%), especially within the group that did not receive adjuvant chemo- or radiotherapy. (e) Untreated individuals (left panel) with few clones in their tumors (blue lines) survive longer than untreated individuals with a large number of clones detected in their tumors (red lines), especially when these few clones share a large CNV burden (blue continuous line). This is not the case for treated individuals (right panel). All hazard ratios were calculated with log-rank tests (** P<0.005; * P<0.05; • P<0.1). For each stratum in panels (a,b,e) at least 50% of the 12 analyzed tumor types were represented at >5% frequency.

Comment in

References

    1. Marusyk A, Polyak K. Tumor heterogeneity: causes and consequences. Biochim Biophys Acta. 2010;1805:105–117. - PMC - PubMed
    1. Bonavia R, Inda MM, Cavenee WK, Furnari FB. Heterogeneity maintenance in glioblastoma: a social network. Cancer Res. 2011;71:4055–4060. - PMC - PubMed
    1. Wang Y, et al. Clonal evolution in breast cancer revealed by single nucleus genome sequencing. Nature. 2014;512:155–160. - PMC - PubMed
    1. Nowell PC. The clonal evolution of tumor cell populations. Science. 1976;194:23–28. - PubMed
    1. Greaves M, Maley CC. Clonal evolution in cancer. Nature. 2012;481:306–313. - PMC - PubMed

Publication types