. 2015 Nov 30:4:e10778.
doi: 10.7554/eLife.10778.

Nanoconnectomic upper bound on the variability of synaptic plasticity

Affiliations

Nanoconnectomic upper bound on the variability of synaptic plasticity

Thomas M Bartol et al. Elife. .

Abstract

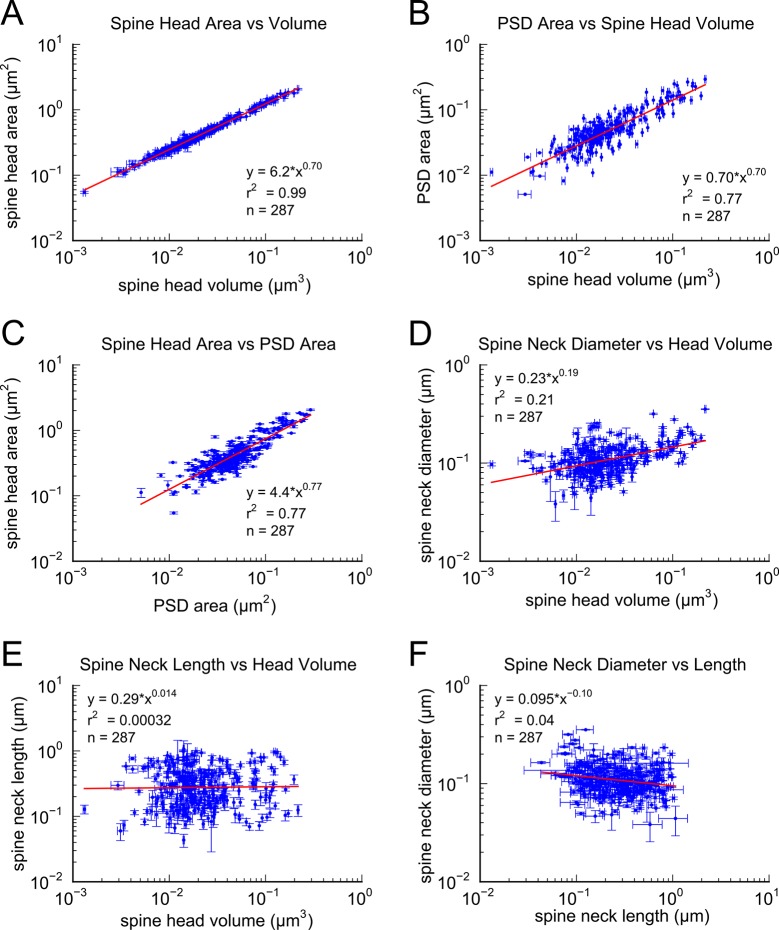
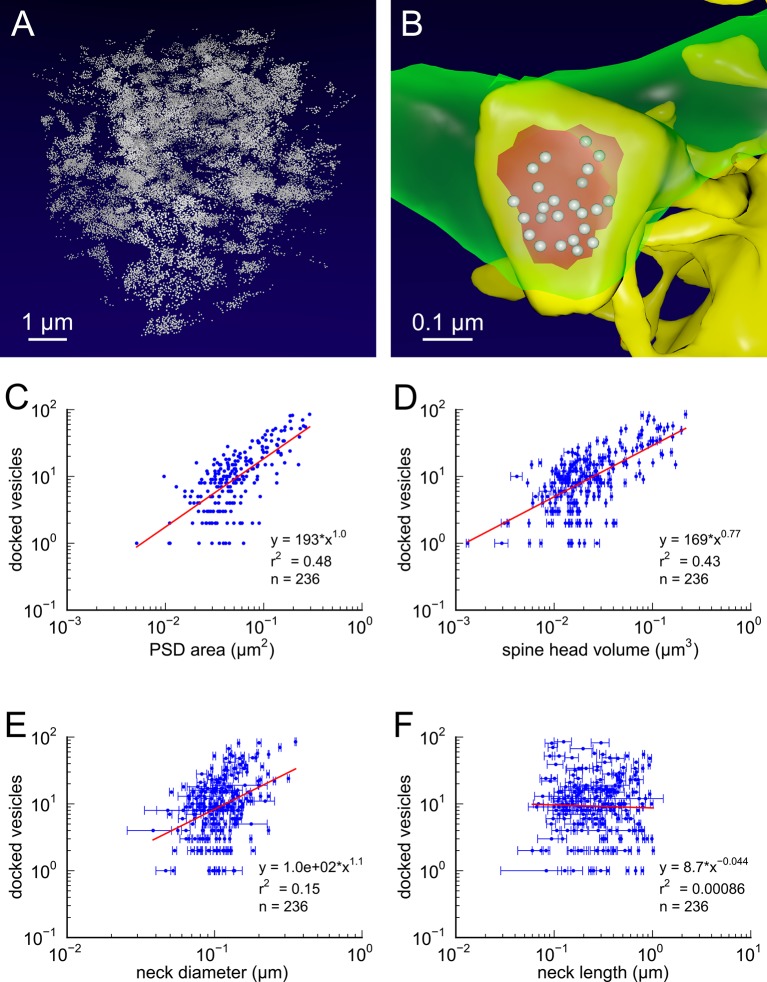
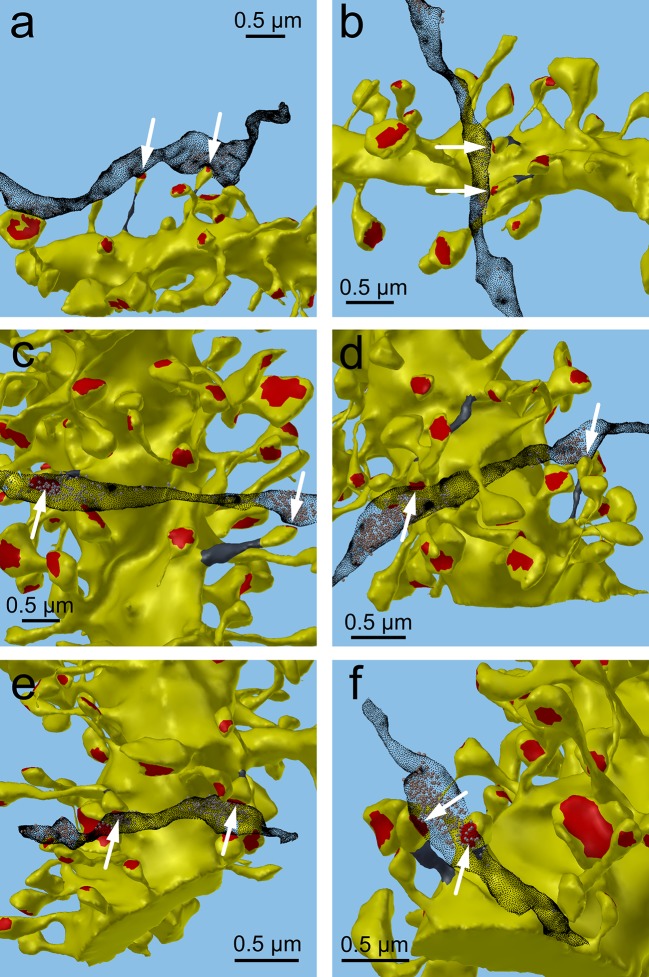
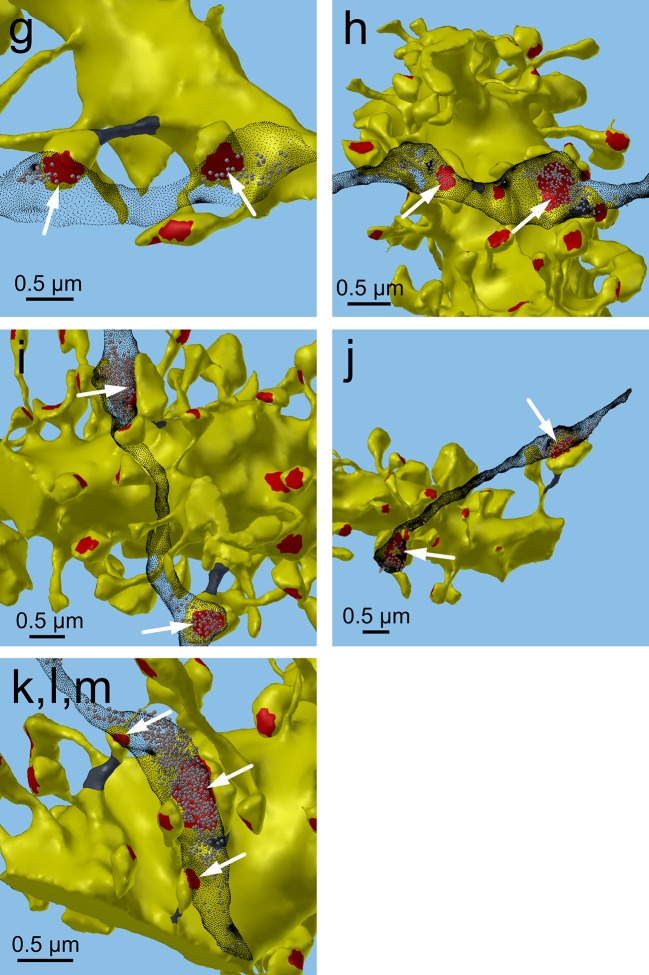
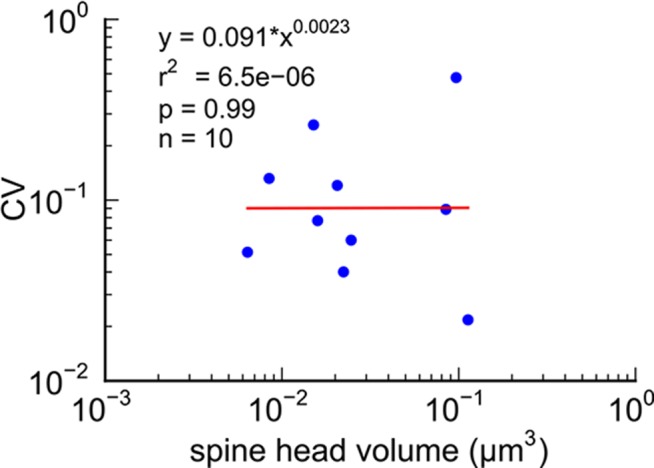
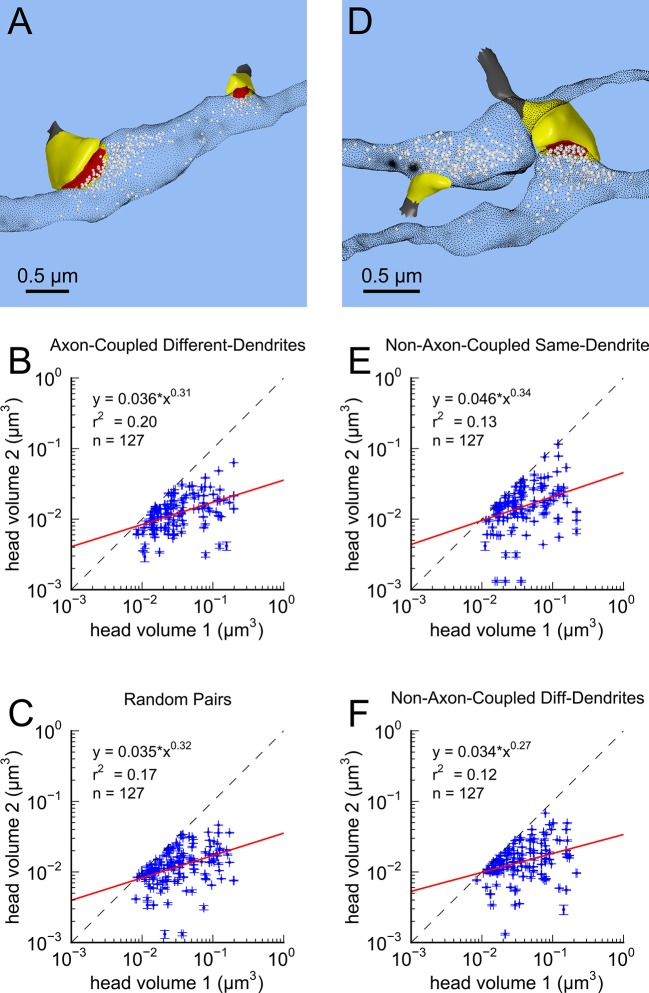
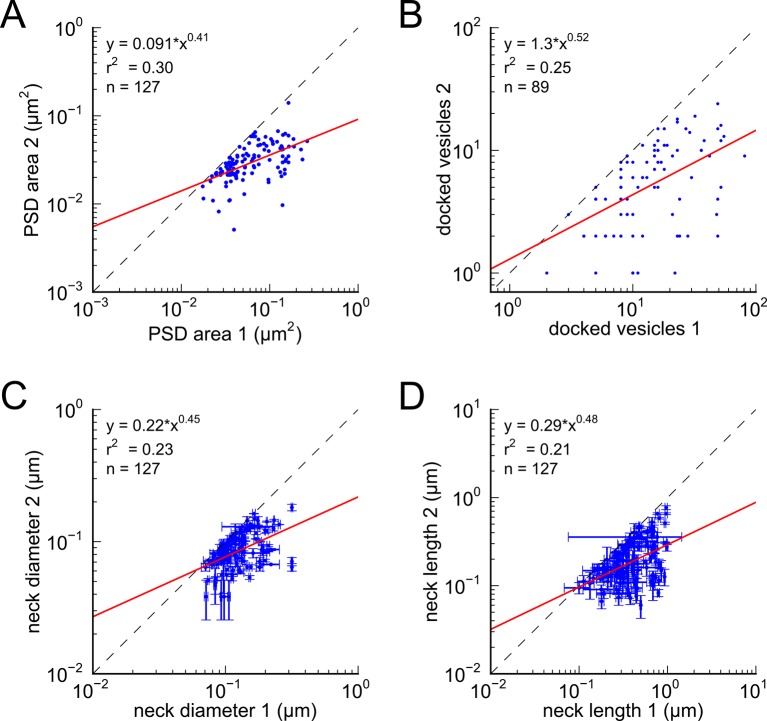
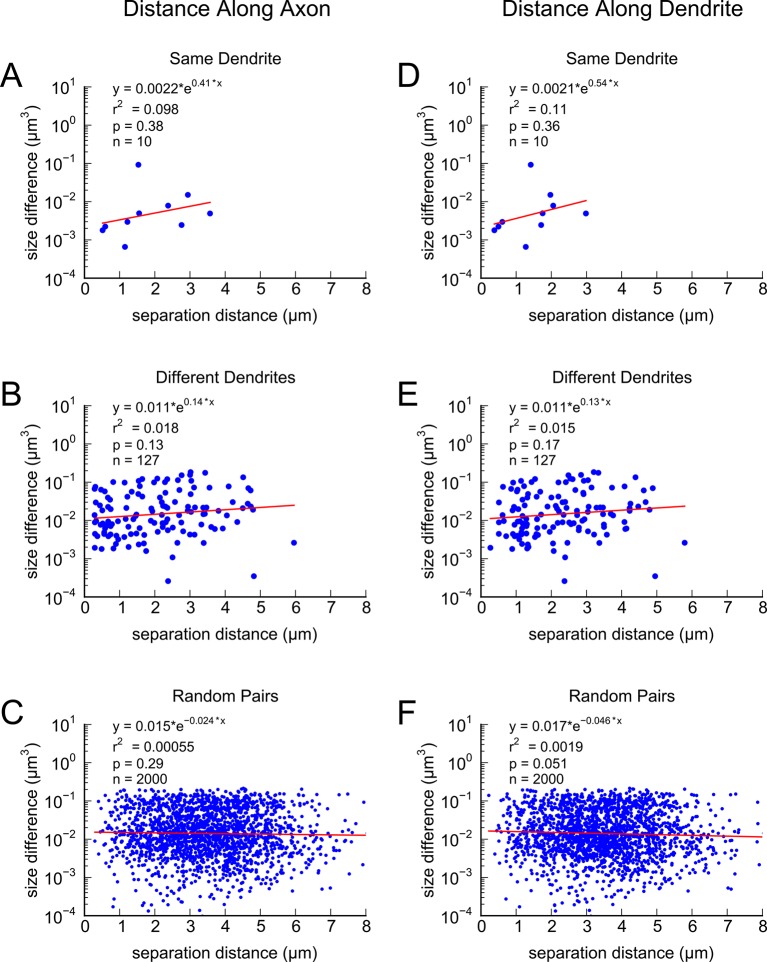
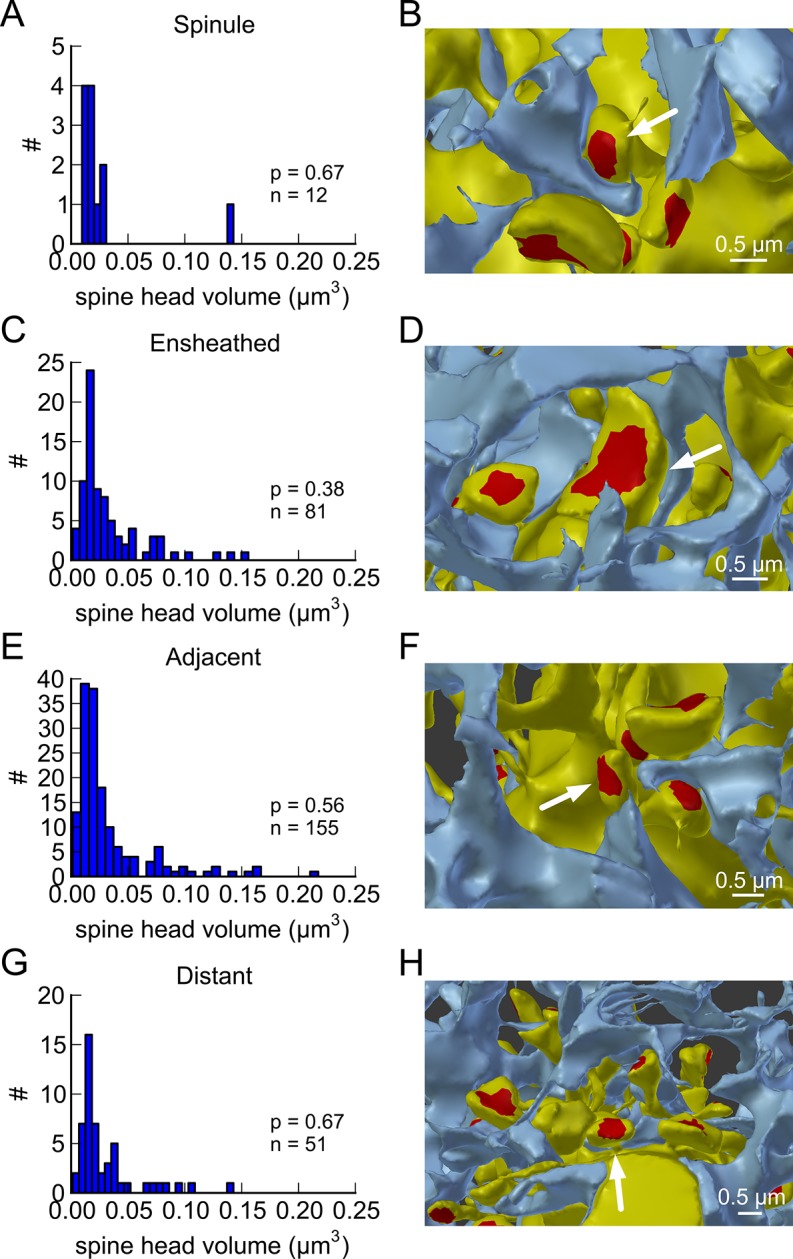
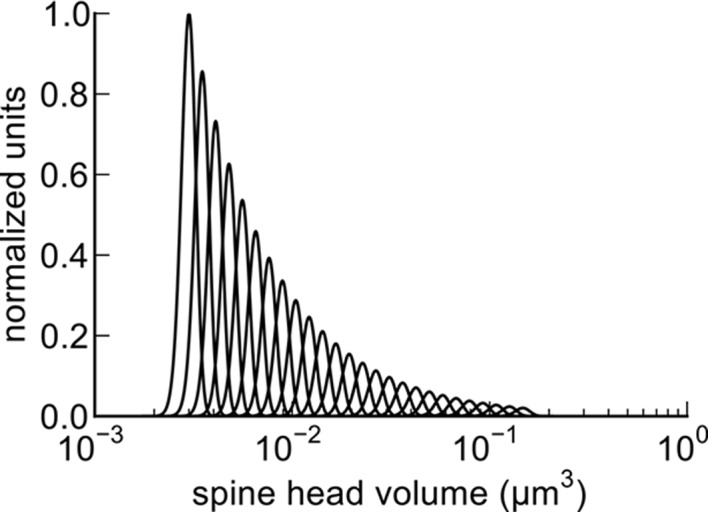
Information in a computer is quantified by the number of bits that can be stored and recovered. An important question about the brain is how much information can be stored at a synapse through synaptic plasticity, which depends on the history of probabilistic synaptic activity. The strong correlation between size and efficacy of a synapse allowed us to estimate the variability of synaptic plasticity. In an EM reconstruction of hippocampal neuropil we found single axons making two or more synaptic contacts onto the same dendrites, having shared histories of presynaptic and postsynaptic activity. The spine heads and neck diameters, but not neck lengths, of these pairs were nearly identical in size. We found that there is a minimum of 26 distinguishable synaptic strengths, corresponding to storing 4.7 bits of information at each synapse. Because of stochastic variability of synaptic activation the observed precision requires averaging activity over several minutes.

Keywords: Connectome; Neural Information Processing; Synaptic Structure and Function; neuroscience; rat.


Conflict of interest statement

The authors declare that no competing interests exist.

Figures

Figure 1.
Figure 1.. Correlations among metrics of dendritic spine morphology.
Strong correlations were found between (A) Spine head area and spine head volume, (B) PSD area and spine head volume, and (C) Spine head area and PSD area. (D) Weak correlation was found between spine neck diameter and spine head volume. No correlation was found between (E) spine neck length and spine head volume and (F) spine neck diameter and spine neck length. Regression lines in red and error bars for each data point represent SEM based on multiple tracers who also edited each spine. Equations are based on the log-log distributions, with r2 values indicated, and n=287 complete spines. DOI: http://dx.doi.org/10.7554/eLife.10778.003
Figure 1—figure supplement 1.
Figure 1—figure supplement 1.. Area of postsynaptic density plotted against spine head volume.
Nine individual dendrites all have similar slopes that are not significantly different showing the uniformity of this comparison across dendrites. Error bars, regression lines and equations as described in Figure 1. DOI: http://dx.doi.org/10.7554/eLife.10778.004
Figure 2.
Figure 2.. Presynaptic docked vesicle numbers are correlated with PSD areas, spine head volumes, and neck diameter, but not with neck length.
(A) All 31,377 presynaptic vesicles. (B) En face view of the 24 docked vesicles (gray spheres) viewed through an axon (green) onto the PSD (red) of example spine (yellow). (C) Number of docked vesicles is correlated strongly with both PSD area and (D) spine head volume, weakly with (E) neck diameter, but is not correlated with (F) spine neck length. Regression lines, SEM (from multiple tracers), and r2 are as in Figure 1 n = 236 complete axonal boutons, each associated with one of the 287 complete spines. One human tracer marked PSDs and vesicles, hence no SEM for these two metrics. DOI: http://dx.doi.org/10.7554/eLife.10778.005
Figure 3.
Figure 3.. Morphometric analysis of 287 complete spines in reconstruction.
Distributions of (A) spine head volumes, (B) PSD areas, (C) docked vesicles, (D) spine neck volumes, (E) spine neck diameters, and (F) spine neck lengths are highly skewed with a long tail. DOI: http://dx.doi.org/10.7554/eLife.10778.006
Figure 3—figure supplement 1.
Figure 3—figure supplement 1.. Spine measurement and estimation of measurement error.
(A) Example segmentation of spine head (yellow), neck (gray), and PSD area (red). (B) Histogram of the measurement error across all spines measured. (C) Measurement error plotted against spine head volume. DOI: http://dx.doi.org/10.7554/eLife.10778.007
Figure 4.
Figure 4.. Spine head volumes, PSD areas and neck diameters, but not neck lengths, are highly correlated between pairs of axon-coupled same-dendrite spines.
(A) Visualization of a pair of spines (gray necks) from the same dendrite (yellow) with synapses (red, indicated by white arrows) on the same axon (black stippling) with presynaptic vesicles (white spheres). (B) All axon-coupled same-dendrite spine pairs (colors as in A, pair c is elaborated in A). Strong correlations with slopes near 1 (dashed diagonal line) occur between paired (C) spine head volumes (slope = 0.91), (D) neck diameters (slope = 0.93), (E) PSD areas (slope = 0.74), and (F) docked vesicles (slope = 0.91); but not (G) spine neck lengths (slope = 0.48). Larger values from each pairing are plotted on the X axis. Regression lines (red) include the 10 a-j pairings (blue points) and 7 pairs from 2 additional animals (green points in (C)), but do not include triplet bouton pairings (k-m, gray points). DOI: http://dx.doi.org/10.7554/eLife.10778.008
Figure 4—figure supplement 1.
Figure 4—figure supplement 1.. Analysis of whole spine volume and spine neck volume of axon-coupled same dendrite spines.
(A) Whole spine volumes of pairs of axon-coupled spines on the same dendrite are highly correlated and significantly different from random pairs (KS test p = 0.018). (B) Correlation of neck volumes of pairs of axon-coupled spines on the same dendrite are not significantly different from random pairs (KS test p = 0.74). Larger value in each pair is plotted on the X axis. Regression lines shown in red. Equations are based on regression of log-log distributions, with r2 values indicated. DOI: http://dx.doi.org/10.7554/eLife.10778.009
Figure 4—figure supplement 2.
Figure 4—figure supplement 2.. Analysis of spines paired randomly.
Distributions represent random pairings of (A) spine head volumes, (B) PSD areas, (C) docked vesicles, (D) neck volumes, (E) neck diameters, and (F) neck lengths, from the population of complete spines in the reconstruction. Larger value in each pair is plotted on the X axis. Regression lines shown in red. Error bars for each data point are not shown for clarity. Equations are based on regression of log-log distributions, with r2 values indicated. DOI: http://dx.doi.org/10.7554/eLife.10778.010
Figure 4—figure supplement 3.
Figure 4—figure supplement 3.. Axon-coupled same dendrite pairs a–f.
Large white arrows indicate the red PSDs of the spine pairs, the edited necks are dark gray, and the axons are stippled black with vesicles inside. These illustrate how the axon weaves through the neuropil, synapses with two spines yet passes by others. DOI: http://dx.doi.org/10.7554/eLife.10778.011
Figure 4—figure supplement 4.
Figure 4—figure supplement 4.. Axon-coupled same-dendrite pairs g-m, illustrated in same way as in Figure 4—figure supplement 3.
DOI: http://dx.doi.org/10.7554/eLife.10778.012
Figure 5.
Figure 5.. CV of axon-coupled spines on the same dendrite does not vary with spine size.
There is no significant correlation, which implies that paired small synapses are as precisely matched as paired large synapses. DOI: http://dx.doi.org/10.7554/eLife.10778.013
Figure 6.
Figure 6.. Paired spine head volumes are not correlated when they are not both axon and dendrite coupled.
(A) Representative visualization and (B) plot showing lack of correlation between spine head volumes of all pairs of axon-coupled spines on different dendrites (n=127). (C) Similarly, randomly associated pairs of spine head volumes were not correlated. (D) Representative visualization and plots show lack of correlation between spine head volumes from randomly selected pairs (n=127) of non-axon-coupled spines (E) on the same or (F) different dendrites. Color scheme and regression analyses as in Figure 4. DOI: http://dx.doi.org/10.7554/eLife.10778.014
Figure 6—figure supplement 1.
Figure 6—figure supplement 1.. Morphologies of PSD, docked vesicles, and necks are not correlated when spines are not both axon and dendrite coupled.
There is no correlation between (A) PSD areas, (B) docked vesicles, (C) neck diameters, and (D) neck lengths, in pairs of axon-coupled spines on different dendrites. DOI: http://dx.doi.org/10.7554/eLife.10778.015
Figure 6—figure supplement 2.
Figure 6—figure supplement 2.. Difference in volume between pairs of axon-coupled spines exhibits a weak trend with separation distance.
Differences in spine head volumes plotted against: A) Distance along the axon for axon-coupled spines on the same dendrite; B) Distance along the axon for axon-coupled spines on different dendrites; C) Distance along the axon for randomly paired spines; D) Distance along the dendrite for axon-coupled spines on the same dendrite; E) Distance along the dendrite for axon-coupled spines on different dendrites; F) Distance along the dendrite for randomly paired spines. DOI: http://dx.doi.org/10.7554/eLife.10778.016
Figure 7.
Figure 7.. Proximity of the glial cell to axon-coupled dendritic spines on either the same or different dendrites.
Proximity of astrocytic glial processes is not significantly correlated with spine head volumes of axon coupled pairs. (A) Histogram of spine head volume for spines that contain a spinule that is engulfed within the glial process (‘ spinule’). (B) Representation of an engulfed spinule. (C) Histogram of spine head volume for spines that are surrounded by and making contact with a glial process (‘ensheathed’). (D) Representation of ‘ensheathed’ spine. (E) Histogram of spine head volume for spines that are proximal but not contacting a glial process (“‘ adjacent”’). (F) Representation of “‘adjacent”’ spine. (G) Histogram of spine head volume for spines that are distant from any glial process. (H) Representation of a spine “‘distant”’ from the glial process. The KS p value is shown on each inset and indicates that none of these distributions differ from the distribution for the whole population of spines. DOI: http://dx.doi.org/10.7554/eLife.10778.017
Figure 8.
Figure 8.. Distinguishable spine sizes.
Over the factor of 60 range in spine head volumes from the data set there are 26 distinguishable intervals of spine sizes with a discrimination probability of 69% for each interval based on signal detection theory (Green and Swets, 1966; Schultz, 2007). The graph illustrates how distinct Gaussian distributions of spine sizes, each with a certain mean size and standard deviation, covers the entire range of spine head sizes on a log scale. The CV of each distribution is a constant value of 0.083 (Figure 5) and the intervals are spaced to achieve a total of 31% overlap with adjacent intervals giving a 69% discrimination threshold (see Materials and Methods). Note that the constant CV observed in the data set (Figure 5) means that the intervals appear uniform in width and spacing on a logarithmic scale. This is a form of non-uniform quantization which efficiently encodes the dynamic range of synaptic strengths at constant precision. DOI: http://dx.doi.org/10.7554/eLife.10778.018

References

    1. Araki Y, Zeng M, Zhang M, Huganir RL. Rapid dispersion of SynGAP from synaptic spines triggers AMPA receptor insertion and spine enlargement during LTP. Neuron. 2015;85:173–189. doi: 10.1016/j.neuron.2014.12.023. - DOI - PMC - PubMed
    1. Ashby MC, Maier SR, Nishimune A, Henley JM. Lateral diffusion drives constitutive exchange of AMPA receptors at dendritic spines and is regulated by spine morphology. Journal of Neuroscience. 2006;26:7046–7055. doi: 10.1523/JNEUROSCI.1235-06.2006. - DOI - PMC - PubMed
    1. Bell ME, Bourne JN, Chirillo MA, Mendenhall JM, Kuwajima M, Harris KM. Dynamics of nascent and active zone ultrastructure as synapses enlarge during long-term potentiation in mature hippocampus. Journal of Comparative Neurology. 2014;522:3861–3884. doi: 10.1002/cne.23646. - DOI - PMC - PubMed
    1. Bi GQ, Poo MM. Synaptic modifications in cultured hippocampal neurons: dependence on spike timing, synaptic strength, and postsynaptic cell type. The Journal of Neuroscience. 1998;18:10464–10472. - PMC - PubMed
    1. Billups B, Forsythe ID. Presynaptic mitochondrial calcium sequestration influences transmission at mammalian central synapses. The Journal of Neuroscience . 2002;22:5840–5847. - PMC - PubMed

Publication types