. 2016 Feb;34(2):155-63.
doi: 10.1038/nbt.3391. Epub 2015 Nov 30.

Identifying recurrent mutations in cancer reveals widespread lineage diversity and mutational specificity

Affiliations

Identifying recurrent mutations in cancer reveals widespread lineage diversity and mutational specificity

Matthew T Chang et al. Nat Biotechnol. 2016 Feb.

Abstract

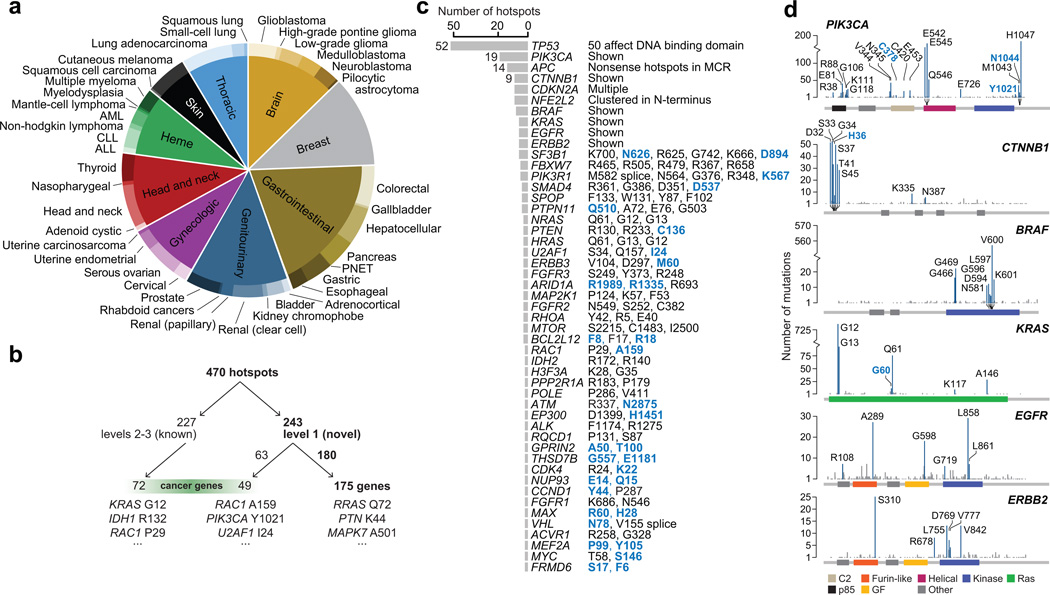
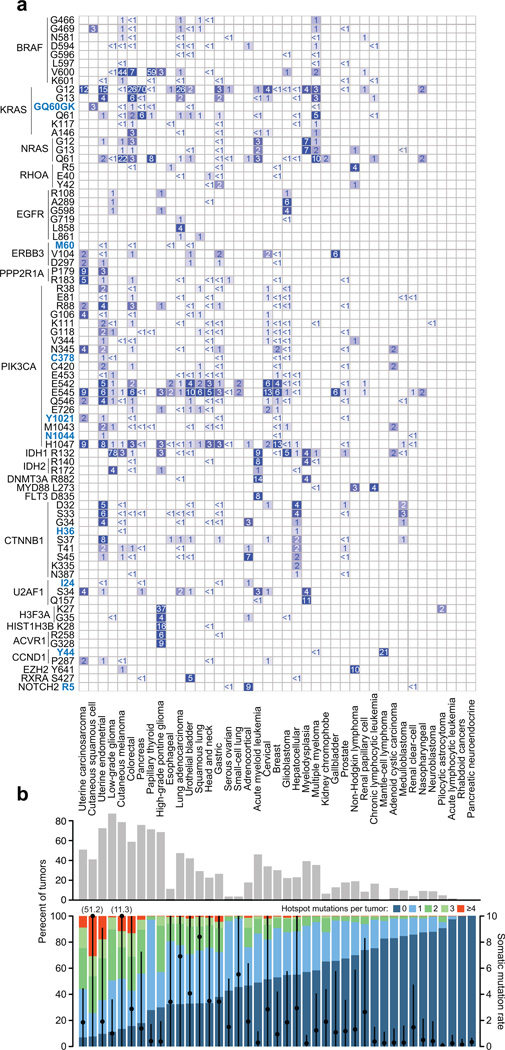
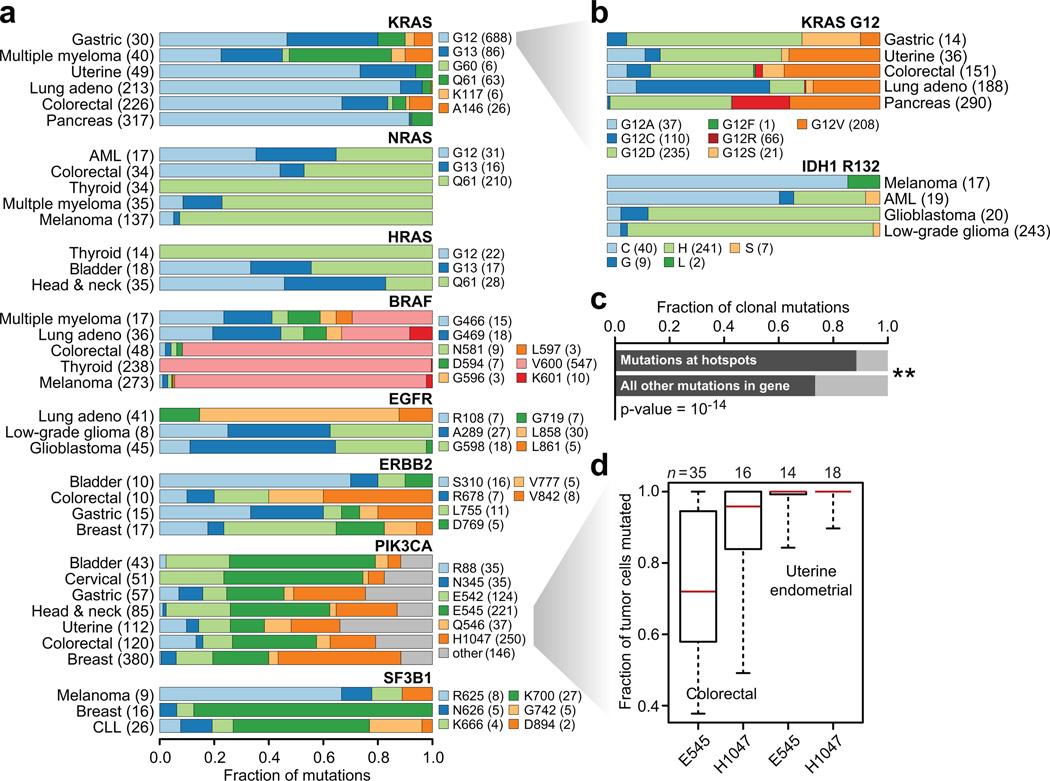
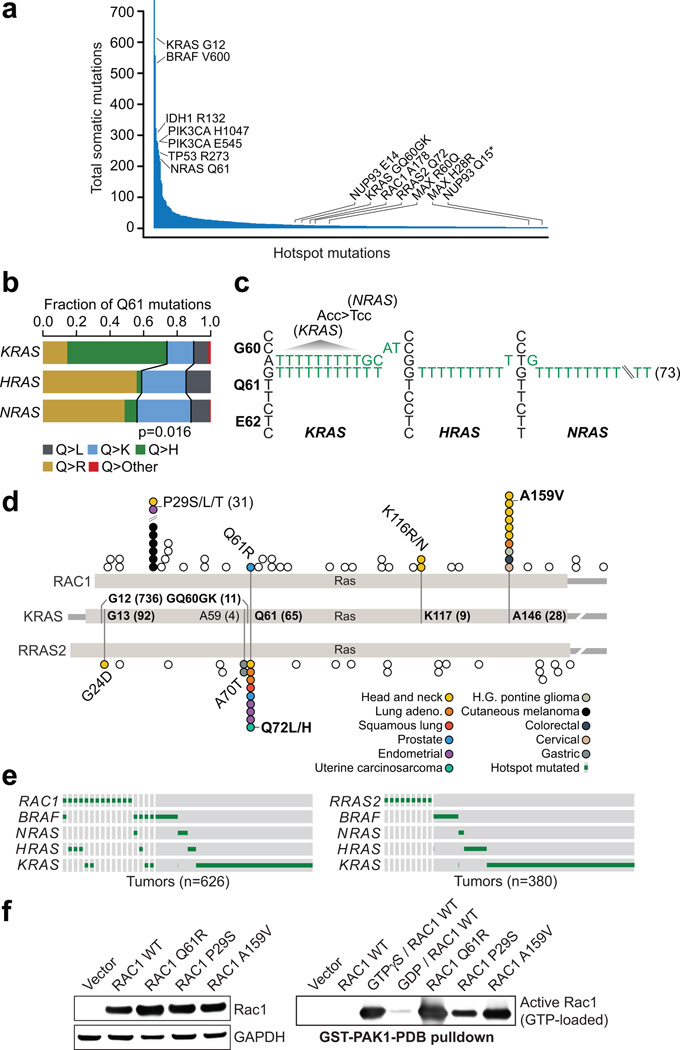
Mutational hotspots indicate selective pressure across a population of tumor samples, but their prevalence within and across cancer types is incompletely characterized. An approach to detect significantly mutated residues, rather than methods that identify recurrently mutated genes, may uncover new biologically and therapeutically relevant driver mutations. Here, we developed a statistical algorithm to identify recurrently mutated residues in tumor samples. We applied the algorithm to 11,119 human tumors, spanning 41 cancer types, and identified 470 somatic substitution hotspots in 275 genes. We find that half of all human tumors possess one or more mutational hotspots with widespread lineage-, position- and mutant allele-specific differences, many of which are likely functional. In total, 243 hotspots were novel and appeared to affect a broad spectrum of molecular function, including hotspots at paralogous residues of Ras-related small GTPases RAC1 and RRAS2. Redefining hotspots at mutant amino acid resolution will help elucidate the allele-specific differences in their function and could have important therapeutic implications.


Figures

Figure 1
Figure 1. Mutational data and hotspot detection
a) The distribution of tumor types included in this analysis. b) Breakdown of known and classified novel hotspots and genes (see Methods). c) The number of hotspots in each of 49 genes with two more hotspots detected across the cohort. At right, a summary of hotspots identified. Novel hotspots are bolded blue. d) The distribution of mutations and hotspots in six oncogenes refines known patterns and reveals new hotspots.
Figure 2
Figure 2. Lineage landscape of hotspot mutations
a) Both common and rare hotspots are largely disseminated across a broad range of malignancies. All hotspots detected in genes with at least one hotspot affecting >5% of tumors of one or more tumor types are shown. Novel hotspots are bolded blue. Genes are grouped broadly by functional similarity, hotspots are ordered by amino acid position, and tumor types (columns, labeled at bottom) are sorted according to the fraction of tumors affected by 1 or more hotspots overall (panel B). The percent of samples altered is represented by colored squares and indicated text. Hotspots in tumor suppressors TP53, PTEN, APC, and FBXW7 were excluded here (see Supplementary Fig. 5). b) The fraction of tumors of a given type (as indicated) affected by one or more hotspots. Black circles represent the median mutation rate (right axis) in the indicated tumor type (bar is the median absolute deviation). Shown at top is the number of tumors of each type with a hotspot mutation affecting a known or candidate oncogene.
Figure 3
Figure 3. Lineage diversity and mutant allele specificity
a) The fraction of cases mutated for each of the most common hotspots in 8 frequently mutated genes in the most commonly mutated lineages indicate substantial lineage diversity and hotspot specificity. b) Same as in panel (a), but for KRAS G12 and IDH1 R132 mutations, showing that mutant amino acid specificity exists within individual hotspots across affected tumor types. c) The fraction of clonal mutations, those present in 80% or more of the tumor cells of affected samples, was higher among mutations in hotspots versus all other non-recurrent mutations in the same genes (χ2 p-value = 1×10⁻¹⁴). d) The fraction of tumor cells mutated for PIK3CA E545 and H1047 hotspots in affected colorectal and uterine endometrial cancers indicates a pattern of allele-specific subclonality for E545 mutations in colorectal cancer.
Figure 4
Figure 4. Candidate Ras-related small GTPase driver mutations in the long tail
a) The frequency distribution of hotspot mutations in cancer has a long right tail of mutated residues that while recurrent, are not common in any cancer type. b) There is a statistically significant difference in the pattern of Q61 codon mutations in KRAS, HRAS, and NRAS2 p-value = 0.016). c) The sequence of Gly60-Glu62 of KRAS, HRAS, and NRAS are shown along with mutant alleles from affected cases indicating the GQ60GK dinucleotide mutation was the only source of KRAS Q61K mutation, whereas the far more common HRAS and NRAS Q61K mutations arose almost exclusively from single nucleotide events. The KRAS G60G synonymous mutation also creates a G60 codon in sequence (ACC>TCC) identical to wildtype sequence of NRAS G60, where Q61 mutations are the most common. d) RAC1, RRAS2, and KRAS are shown in schematic form indicating the position of novel hotspots RAC1 A159V and RRAS2 Q72L/H at paralogous residues in the Ras domain to known activating mutations in KRAS (A146 and Q61 respectively). e) The pattern of RAC1 (left) and RRAS2 (right) mutations along with those in BRAF and Ras genes in affected tumor types. f) RAC1 activation (GTP-bound RAC1) by PAK1 pull-down (right). RAC1 A159V was associated with significant RAC1 activation to levels equal to or exceeding the positive control GTPγS and greater than those of the known oncogenic RAC1 P29S.

References

    1. Vogelstein B, et al. Cancer genome landscapes. Science. 2013;339:1546–1558. - PMC - PubMed
    1. Garraway LA, Lander ES. Lessons from the cancer genome. Cell. 2013;153:17–37. - PubMed
    1. Tamborero D, et al. Comprehensive identification of mutational cancer driver genes across 12 tumor types. Sci Rep. 2013;3:2650. - PMC - PubMed
    1. Lawrence MS, et al. Mutational heterogeneity in cancer and the search for new cancer-associated genes. Nature. 2013;499:214–218. - PMC - PubMed
    1. Kandoth C, et al. Mutational landscape and significance across 12 major cancer types. Nature. 2013;502:333–339. - PMC - PubMed

Online Methods-only References

    1. Cerami E, et al. The cBio cancer genomics portal: an open platform for exploring multidimensional cancer genomics data. Cancer Discov. 2012;2:401–404. - PMC - PubMed
    1. Gao J, et al. Integrative analysis of complex cancer genomics and clinical profiles using the cBioPortal. Sci Signal. 2013;6:pl1. - PMC - PubMed
    1. Karolchik D, et al. The UCSC Genome Browser database: 2014 update. Nucleic Acids Res. 2014;42:D764–D770. - PMC - PubMed
    1. McLaren W, et al. Deriving the consequences of genomic variants with the Ensembl API and SNP Effect Predictor. Bioinformatics. 2010;26:2069–2070. - PMC - PubMed
    1. Benjamini Y, Yekutieli D. The control of the false discovery rate in multiple testing under dependency. Annals of Statistics. 2001;29:1165–1188.

Publication types