. 2016 Jan;126(1):195-206.
doi: 10.1172/JCI84015. Epub 2015 Nov 30.

RBFox1-mediated RNA splicing regulates cardiac hypertrophy and heart failure

RBFox1-mediated RNA splicing regulates cardiac hypertrophy and heart failure

Chen Gao et al. J Clin Invest. 2016 Jan.

Abstract

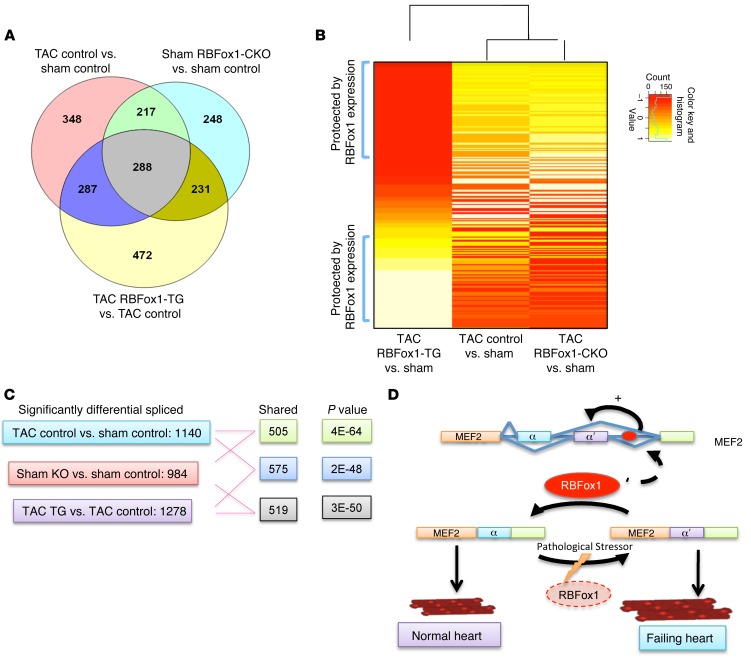
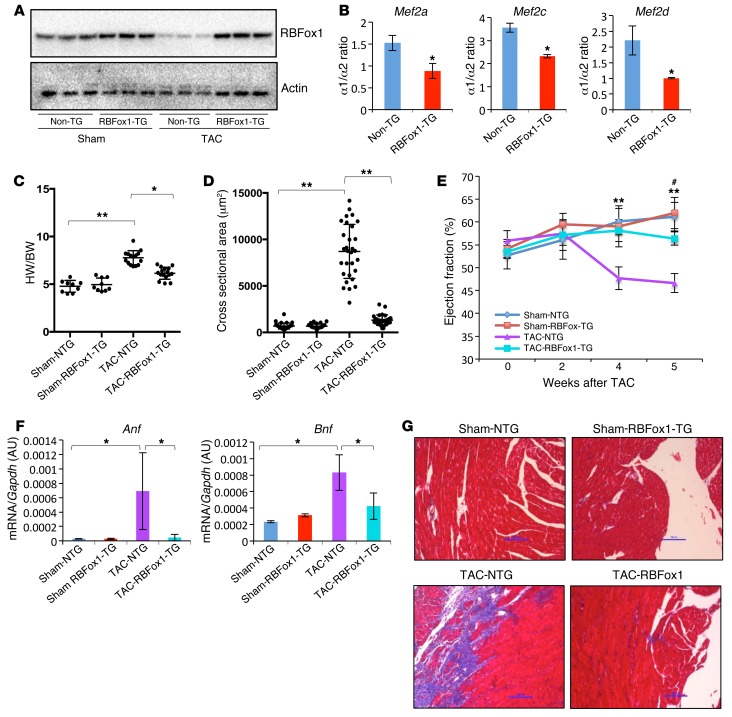
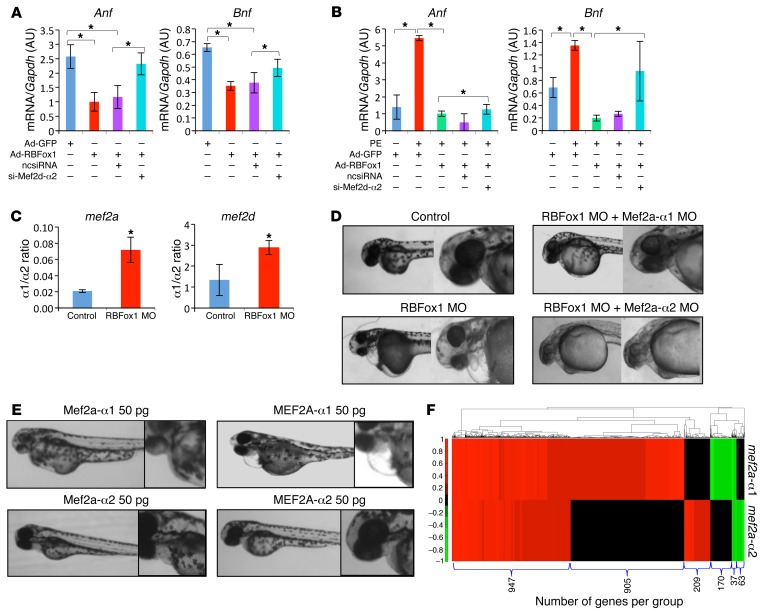
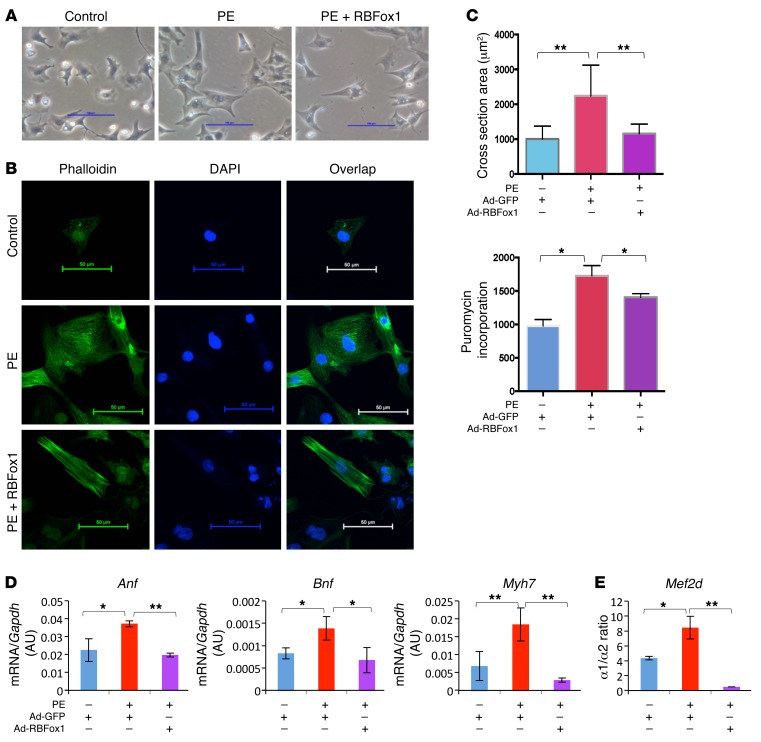
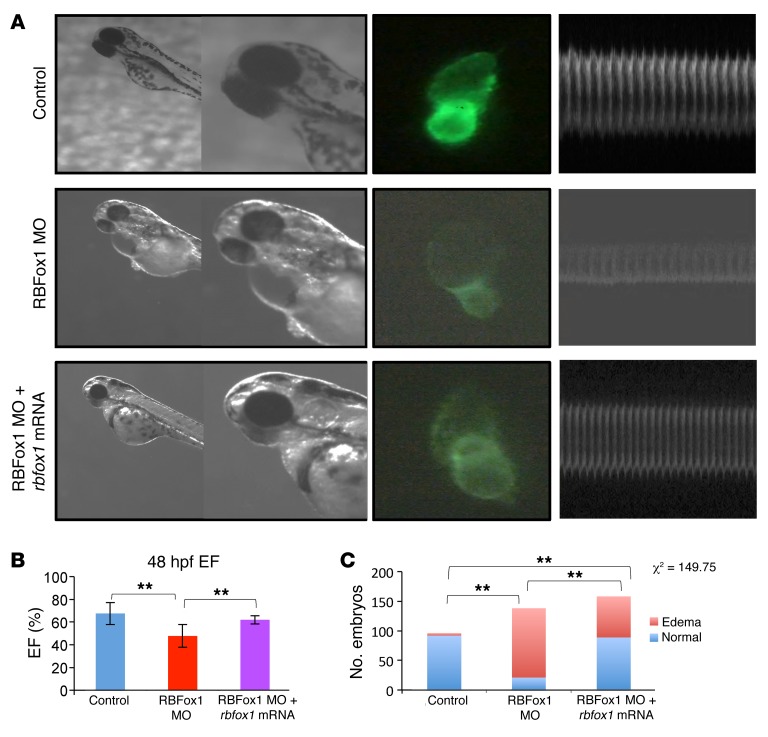
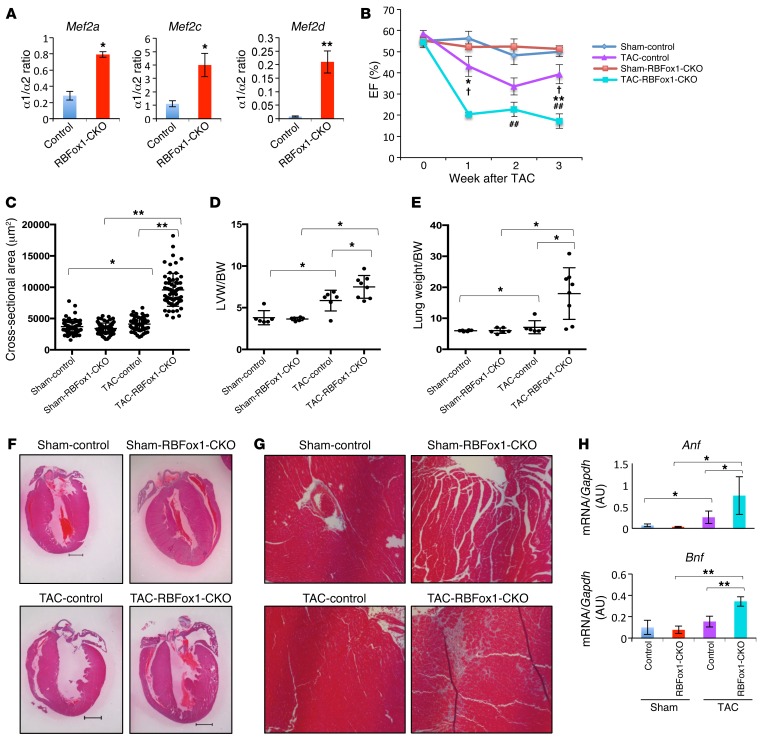
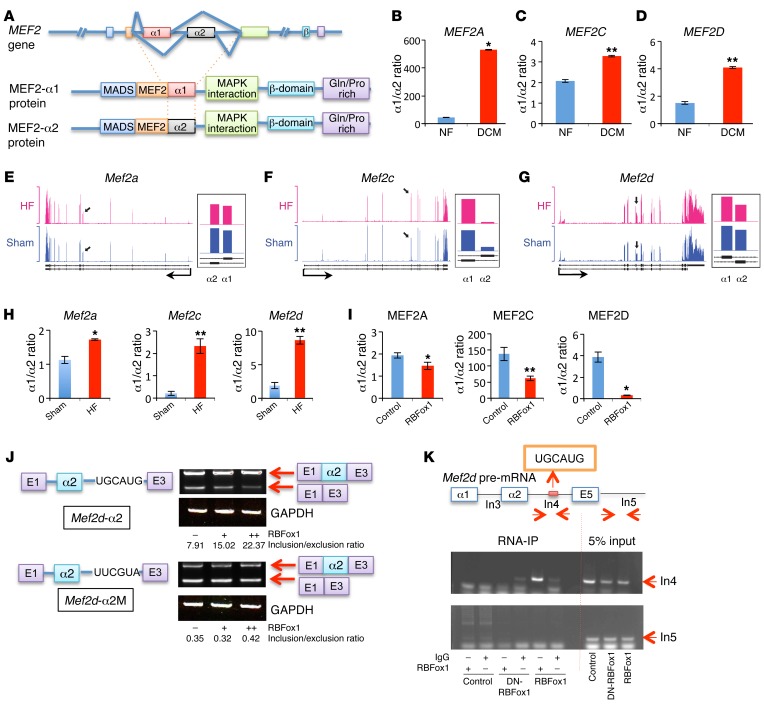
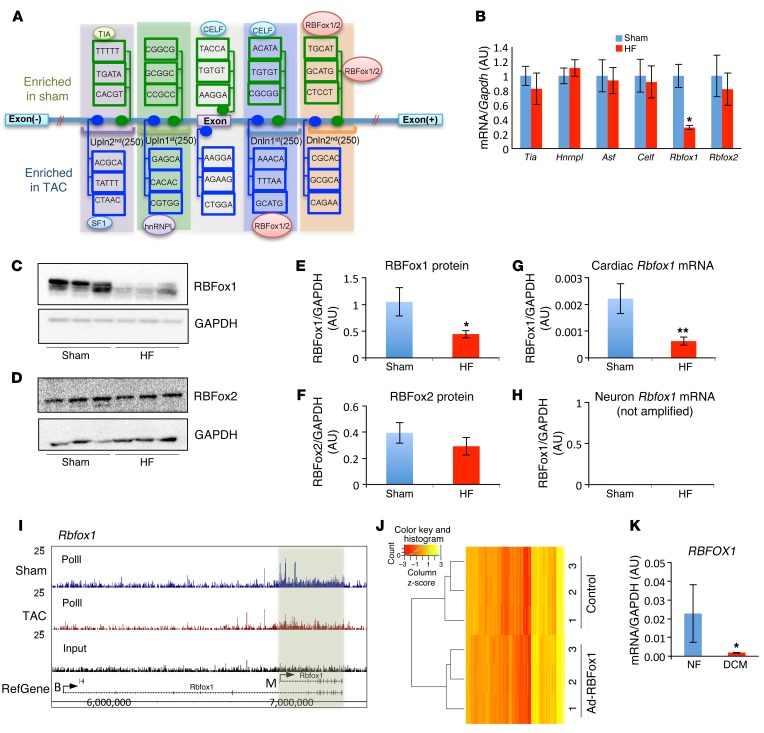
RNA splicing is a major contributor to total transcriptome complexity; however, the functional role and regulation of splicing in heart failure remain poorly understood. Here, we used a total transcriptome profiling and bioinformatic analysis approach and identified a muscle-specific isoform of an RNA splicing regulator, RBFox1 (also known as A2BP1), as a prominent regulator of alternative RNA splicing during heart failure. Evaluation of developing murine and zebrafish hearts revealed that RBFox1 is induced during postnatal cardiac maturation. However, we found that RBFox1 is markedly diminished in failing human and mouse hearts. In a mouse model, RBFox1 deficiency in the heart promoted pressure overload-induced heart failure. We determined that RBFox1 is a potent regulator of RNA splicing and is required for a conserved splicing process of transcription factor MEF2 family members that yields different MEF2 isoforms with differential effects on cardiac hypertrophic gene expression. Finally, induction of RBFox1 expression in murine pressure overload models substantially attenuated cardiac hypertrophy and pathological manifestations. Together, this study identifies regulation of RNA splicing by RBFox1 as an important player in transcriptome reprogramming during heart failure that influence pathogenesis of the disease.


Figures

Figure 8
Figure 8. RBFox1 contributes to global RNA splicing reprogramming during HF.
(A) Venn diagram showing differentially spliced exons in hearts identified by RASL-seq (WT sham, n = 5; WT TAC, n = 7; RBFox1-TG TAC, n = 3; RBFox1-CKO sham, n = 3) (RASL-seq was also performed for RBFox1-TG sham and RBFox1-CKO TAC [data not shown]; RBFox1-TG sham, n = 4; RBFox1-CKO TAC, n = 3). (B) Heatmap depicting the 339 differentially spliced exons between TAC- and sham-operated mice identified in all 3 genotypes (WT, RBFox-TG, and RBFox-CKO). Data are row-scaled, and the blue bar in the key is a histogram of the splicing values plotted in the heatmap. (C) Shared splicing events across different samples together with P values. (D) Graphic abstract.
Figure 7
Figure 7. Restoring RBFox1 prevented pathological hypertrophy in pressure-overloaded mouse hearts.
(A) Western blot analysis of RBFox1 protein in wild-type or single-transgenic hearts (Non-TG) compared with double-transgenic hearts (RBFox1-TG) 6 weeks following sham or TAC operation. (B) Quantification of Mef2 α1/α2 transcript ratio in non-TG and RBFox1-TG hearts after 2 weeks of doxycycline induction (n = 3 each sample). *P < 0.05. (C) Heart weight (HW) and body weight ratios in sham-operated mice and non-TG (NTG) and RBFox1-TG mice 6 weeks after TAC (Sham-NTG, n = 9; Sham-RBFox1-TG, n = 9; TAC-NTG, n = 15; TAC-RBFox1-TG, n = 16). *P < 0.05, **P < 0.01. (D) Cross-sectional area of cardiomyocytes in sham-operated mice and non-TG or RBFox1-TG mice after TAC. Average values were derived from 100 myocytes of from each group. **P < 0.05. (E) Ejection fraction of sham- and TAC-operated non-TG and RBFox1-TG mice measured by echocardiography up to 5 weeks after TAC (Sham-NTG, n = 9; Sham-RBFox1-TG, n = 9; TAC-NTG, n = 15; TAC-RBFox1-TG, n = 16). **P < 0.05, TAC-NTG vs. TAC-RBFox1-TG. #P < 0.05, Sham-NTG vs. TAC-NTG. (F) Anf and Bnp mRNA expression levels in non-TG and RBFox1-TG mice following sham surgery or 5 weeks after TAC (n = 3 each group). *P < 0.05. (G) Representative images of Masson trichrome–stained ventricular sections from the sham- and TAC-operated non-TG and RBFox1-TG mice as indicated. Original magnification, ×20. Data are representative of at least 3 independent experiments. Significant differences between groups were determined by Student’s t test (B) or multiway ANOVA (CF).
Figure 6
Figure 6. RBFox1/MEF2 regulatory circuit in cardiomyocyte hypertrophy regulation.
(A) Anf and Bnp expression in NRVMs following GFP or RBFox1 expression, with or without coexpressing a scrambled siRNA (ncsiRNA) or an siRNA targeting Mef2d α2 isoform (si-Mef2d-α2) as indicated (n = 3 each sample). (B) Anf and Bnp expression in NRVMs with or without PE treatment or RBFox1 expression or coexpressing a scrambled siRNA or an siRNA targeted to Mef2d α2 isoform (n = 3 each sample). (C) mef2a and mef2d α1/α2 ratio in RBFox1 morpholino–injected hearts compared with control zebrafish embryo hearts (n = 3 each sample). (D) Zebrafish phenotype upon RBFox1 and Mef2a inactivation. Zebrafish embryos were injected with morpholino targeting RBFox1 alone or in combination with Mef2a α1 or α2 isoform–specific morpholino. Embryo phenotype was analyzed at 48 hours after fertilization. Original magnification, ×1 (first column); ×11 (second column). (E) Zebrafish phenotype upon expression of zebrafish Mef2a α1 or zebrafish Mef2a α2, mouse MEF2A α1, and mouse MEF2A α2 at indicated dose imaged at 48 hours after fertilization. Original magnification, ×1 (first column); ×11 (second column). (F) Gene expression profile in the zebrafish embryos 24 hours following expression of individual mef2a α1 or α2 isoforms analyzed by RNA-seq. The heatmap was generated using significantly upregulated (red) and downregulated (green) genes. *P < 0.05, Student’s t test (AC).
Figure 5
Figure 5. RBFox1 plays important role in cardiomyocyte hypertrophy.
(A) Representative bright-field images of NRVMs 48 hours after treatment with PE and infection with GFP (Control) or RBFox1-expressing adenovirus (RBFox1). Original magnification, ×20. (B) Phalloidin staining of NRVMs treated with PE alone or in combination with RBFox1-expressing adenovirus. Green, phalloidin; blue, Hoechst. Original magnification, ×40. Data are representative of at least 3 independent experiments. (C) Cell surface area of NRVMs from the same experimental groups as in A. Cells were stained with wheat germ agglutinin. 100 cells were measured from total of 3 independent experimental samples. Protein synthesis rates as quantified by puromycin incorporation in NRVMs from the same experimental samples as in A following 30 minutes of puromycin labeling (n = 3 each sample). (D) Anf, Bnp, and Myh7 expression in NRVMs following 48 hours of PE treatment in combination with GFP or RBFox1 adenovirus infection (n = 3 each group). (E) Relative Mef2d α1/α2 transcript ratios from the same sample group as in C. *P < 0.05, **P < 0.01, Student’s t test (CE).
Figure 4
Figure 4. Genetic inactivation of rbfox1 exacerbates cardiac hypertrophy and HF in zebrafish.
(A) Zebrafish were injected with control, RBFox1 morpholino (MO) alone, or in combination with zebrafish rbfox1l mRNA. Embryos were analyzed at 48 hours after fertilization (hpf) (original magnification, ×1 [first column]; ×11 [second column]), and hearts were visualized under fluorescent microscope (original magnification, ×11) and recorded to facilitate cardiac function analysis (zebrafish M-mode echocardiography) based on software as described elsewhere (9). (B) Quantification of zebrafish cardiac ejection fraction in the 3 experimental groups (n = 30 per sample). (C) Summary of injection and the number of pericardial edema observed. **P < 0.01, multiway ANOVA (B) or Fisher’s exact test (C).
Figure 3
Figure 3. Genetic inactivation of Rbfox1 exacerbates cardiac hypertrophy and HF in mice.
(A) Mef2 α1/α2 transcript ratios in 3-month-old wild-type (Control) and RBFox1-CKO mouse hearts at basal state (n = 3 from each group). *P < 0.05, **P < 0.01. (B) Ejection fraction values of sham- and TAC-operated control and RBFox1-CKO littermates measured by echocardiography (Sham-control, n = 6; Sham-RBFox1-CKO, n = 6; TAC-control, n = 6; TAC-RBFox1-CKO, n = 8). *P < 0.05, **P < 0.01, TAC-control vs. TAC-RBFox1-CKO; P < 0.05, Sham-RBFox1-CKO vs. TAC-RBFox1-CKO; ##P < 0.05, Sham-control vs. TAC-control. (C) Cross-sectional myofiber area in LVs of sham- and TAC-operated control and RBFox1-CKO hearts 3 weeks after TAC. The values were averaged from 60 slides prepared from 3 hearts in each group. *P < 0.05, **P < 0.01. (D) LV weight (LVW) and body weight (BW) ratios from sham- and TAC-operated control and RBFox1-CKO mice 3 weeks after TAC (control, n = 10; RBFox1-CKO, n = 9). *P < 0.05. (E) Lung weight and body weight ratios among the sham, control, and RBFox1-CKO mice 3 weeks after TAC (control, n = 10; RBFox1-CKO, n = 9). *P < 0.05. (F) Representative cross-sectional images of hematoxylin & eosin staining of LV tissues from control and RBFox1-CKO mice following sham surgery or 3 weeks after TAC. Original magnification, ×2. (G) Representative Masson’s trichrome staining of sham- and TAC-treated control and RBFox1-CKO mouse heart sections. Original magnification, ×20. Data are representative of at least 3 independent experiments. (H) Anf and Bnp expression levels in the sham- and TAC-treated hearts from control and RBFox1-CKO mice as indicated (n = 4 each group). *P < 0.05, **P < 0.01. Significant differences between groups were determined by Student’s t test (A) or multiway ANOVA (BE and H).
Figure 2
Figure 2. RBFox1 specifically regulates MEF2 α exon inclusion change in failing hearts.
(A) Schematic of the MEF2 gene splicing variants at α exon. (BD) Quantification of the MEF2 α1/α2 ratio in nonfailing (NF) and dilated cardiomyopathy (DCM) human heart samples (n = 4 from each group). (EG) Exon-specific RNA reads of the Mef2 genes in failing heart and sham samples based on an RNA-seq data set (43). Black arrows represent the locations of mutually exclusive exons (MXEs) in each gene, and the detail expression profiles (presented as reads per kilobase per million mapped read values) of MXEs at higher magnification are shown to the right. (H) qRT-PCR quantification of Mef2 (Mef2a, Mef2c, and Mef2d) α1 versus α2 transcript ratios from sham hearts (Control) and hearts after TAC (HF) (n = 3 from each group). (I) MEF2 α1/α2 transcript ratio in the control and RBFox1-overexpressing NRVMs (n = 3 from each group). (J) Schematic of the Mef2d α2 exon minigene reporter constructs containing wild-type (Mef2d-α2) or mutated (Mef2d-α2M) RBFox1-binding motif as indicated. Different minigene reporter constructs were transfected alone or in combination with an RBFox1-expressing vector in HEK293 cells. Exon inclusion level was measured by densitometry analysis of RT-PCR products separated by electrophoresis on a 4% agarose gel and indicated as inclusion/exclusion ratio. (K) Cross-link RNA immunoprecipitation assay of Mef2d pre-mRNA sequence. Myoblasts were infected with dominant-negative RBFox1 (DN-RBFox1) and RBFox1 and compared with the mock infected cells. RBFox1 binding to different regions of Mef2d pre-mRNA was detected by semiquantitative RT-PCR as indicated. *P < 0.05, **P < 0.01, Student’s t test (BD, H, and I).
Figure 1
Figure 1. RBFox1 is a key splicing regulator repressed in failing hearts.
(A) Schematic of de novo motif discovery from alternative splicing events. A total of five regions — exon; upstream first 250 bp (Upln 1st); upstream second 250 bp (Upln 2nd); downstream first 250 bp (Dnln 1st); and downstream second 250 bp (Dnln 2nd) — were analyzed. The enriched and conserved motif were indicated with their binding protein. (B) Relative mRNA levels of 6 enriched splicing regulators in sham hearts and hearts after TAC (HF) (n = 3 from each group). Data in both C and D were normalized to GAPDH. Western Blot analysis of RBFox1 and RBFox2 expression levels in normal (Sham) and TAC-induced failing hearts (HF) (n = 3 each sample). (E and F) Quantification of protein expression levels of (E) RBFox1 and (F) RBFox2 in sham-operated hearts compared with those in TAC-induced failing hearts based on Western blot shown in C and D. (G and H) Real-time PCR was performed in TAC- and sham-operated mouse hearts using primers (see Supplemental Table 3) designed specifically targeting either (G) cardiac or (H) neuron Rbfox1 splicing variants (n = 3 each sample). (I) RNA polymerase II occupation on the mouse Rbfox1 gene in sham-operated hearts compared with that in hearts 4 days after TAC. A fragment density of 25 is shown throughout. (J) Heatmap depicting sample-scaled expression of 132 exons significantly changed in the RBFox1-expressing NRVMs identified by RNA-seq and RASL-seq. The blue line in the key is a histogram of the values plotted in the heatmap. (K) Quantification of RBFOX1 mRNA expression in nonfailing (NF) and dilated cardiomyopathy (DCM) human heart samples (n = 4 from each group). *P < 0.05, **P < 0.01, Student’s t test (B, E, G, and K).

References

    1. Chen M, Manley JL. Mechanisms of alternative splicing regulation: insights from molecular and genomics approaches. Nat Rev Mol Cell Biol. 2009;10(11):741–754. - PMC - PubMed
    1. Pan Q, Shai O, Lee LJ, Frey BJ, Blencowe BJ. Deep surveying of alternative splicing complexity in the human transcriptome by high-throughput sequencing. Nat Genet. 2008;40(12):1413–1415. doi: 10.1038/ng.259. - DOI - PubMed
    1. Wang Z, Gerstein M, Snyder M. RNA-Seq: a revolutionary tool for transcriptomics. Nat Rev Genet. 2009;10(1):57–63. doi: 10.1038/nrg2484. - DOI - PMC - PubMed
    1. Hallegger M, Llorian M, Smith CW. Alternative splicing: global insights. FEBS J. 2010;277(4):856–866. doi: 10.1111/j.1742-4658.2009.07521.x. - DOI - PubMed
    1. Raghavachari N, et al. A systematic comparison and evaluation of high density exon arrays and RNA-seq technology used to unravel the peripheral blood transcriptome of sickle cell disease. BMC Med Genomics. 2012;5(1):28–48. doi: 10.1186/1755-8794-5-28. - DOI - PMC - PubMed

Publication types