. 2015 Nov 30;11(11):e1005658.
doi: 10.1371/journal.pgen.1005658. eCollection 2015 Nov.

Variation in Rural African Gut Microbiota Is Strongly Correlated with Colonization by Entamoeba and Subsistence

Affiliations

Variation in Rural African Gut Microbiota Is Strongly Correlated with Colonization by Entamoeba and Subsistence

Elise R Morton et al. PLoS Genet. .

Abstract

The human gut microbiota is impacted by host nutrition and health status and therefore represents a potentially adaptive phenotype influenced by metabolic and immune constraints. Previous studies contrasting rural populations in developing countries to urban industrialized ones have shown that industrialization is strongly correlated with patterns in human gut microbiota; however, we know little about the relative contribution of factors such as climate, diet, medicine, hygiene practices, host genetics, and parasitism. Here, we focus on fine-scale comparisons of African rural populations in order to (i) contrast the gut microbiota of populations inhabiting similar environments but having different traditional subsistence modes and either shared or distinct genetic ancestry, and (ii) examine the relationship between gut parasites and bacterial communities. Characterizing the fecal microbiota of Pygmy hunter-gatherers as well as Bantu individuals from both farming and fishing populations in Southwest Cameroon, we found that the gut parasite Entamoeba is significantly correlated with microbiome composition and diversity. We show that across populations, colonization by this protozoa can be predicted with 79% accuracy based on the composition of an individual's gut microbiota, and that several of the taxa most important for distinguishing Entamoeba absence or presence are signature taxa for autoimmune disorders. We also found gut communities to vary significantly with subsistence mode, notably with some taxa previously shown to be enriched in other hunter-gatherers groups (in Tanzania and Peru) also discriminating hunter-gatherers from neighboring farming or fishing populations in Cameroon.


Conflict of interest statement

The authors declared that no competing interests exist.

Figures

Fig 1
Fig 1. (a) Map showing the geographic locations of the villages sampled in Southwest Cameroon, the number of samples (N) collected for each subsistence group (the fishing population, farmers from the South, farmers from the North, and hunter-gatherers), and their genetic ancestry (Bantu or Pygmy).
(b) Principle Components Analysis based on dietary questionnaires for all 64 individuals. The first two principal components (PC1 and PC2) are shown, with the amount of variation explained reported for each axis. Image of Africa is courtesy of NASA/JPL-Caltech.
Fig 2
Fig 2. Relationship between the presence of Entamoeba (Ent- or Ent+) and fecal microbiome composition.
(a) Multidimensional Scaling plot of unweighted UniFrac distances colored by Entamoeba presence or absence. The first two principal components (PC1 and PC2 are shown). (b) Summary of the relative abundance of taxa (> = 0.1% in at least 4 individuals) for Ent- and Ent+ individuals color coded by phylum (Actinobacteria (Act.) = red, Bacteroidetes (Bact.) = green, Cyanobacteria (Cyan.) = black, Elusimicrobia (Elus.) = gold, Firmicutes (Firm.) = blue, Fusobacteria (Fus.) = pink, Lentisphaerae (Lent.) = yellow, Proteobacteria (Prot.) = purple, Spirochaetes (Spir.) = orange, and Tenericutes (Ten.) = gray). The number of individuals (N) in each population is indicated below the bars. (c) Normalized relative abundance of four taxa significantly associated with Entamoeba presence/absence in an ANOVA as well as in the random forest classifier model (q < 0.05).
Fig 3
Fig 3. (a) Comparison of alpha diversity for Entamoeba negative (Ent-) and positive (Ent+) individuals using the phylogenetic distance whole tree metric.
(b) Comparison of beta diversity within Ent-, within Ent+, and between Ent- and Ent+ individuals based on unweighted UniFrac distances. P-values are based on Welch’s t-test.
Fig 4
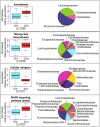
Fig 4. Normalized relative abundance of KEGG metabolic pathways significantly associated with Entamoeba status in an ANOVA (q < 0.05 using the most abundant; ≤ 0.4% in at least one group) (left panel) and the relative contributions of each taxon for each pathway (right panel).
Fig 5
Fig 5. Relationship between subsistence modes and fecal microbiome composition.
(a) Summary of the relative abundance of taxa (occurring at > = 0.1% in at least 4 individuals) for individuals across subsistence. Taxa are colored by phylum (Actinobacteria (Act.) = red, Bacteroidetes (Bact.) = green, Cyanobacteria (Cyan.) = black, Elusimicrobia (Elus.) = gold, Firmicutes (Firm.) = blue, Fusobacteria (Fus.) = pink, Lentisphaerae (Lent.) = yellow, Proteobacteria (Prot.) = purple, Spirochaetes (Spir.) = orange, and Tenericutes (Ten.) = gray). The number of individuals (N) in each population is indicated below the bars. (b) Relative abundance of four taxa significantly associated with subsistence based on an ANOVA, q < 0.05. Fis = Fishing population; Far(S) = Farmers from the South; Far(N) = Farmers from the North; HG = Hunter-gatherers.
Fig 6
Fig 6. Comparison of the diversity of gut microbiomes of individuals across subsistence (a) Alpha diversity based on the phylogenetic metric, phylogenetic distance (PD) whole tree.
(b) Beta diversity within each subsistence group based on unweighted UniFrac distances. (c) Beta diversity for pairs of subsistence groups based on unweighted UniFrac distances. For pairwise comparisons, all are significant (p < 0.05 unless specified (n.s.); Welch’s t-test). All p-values are based on Welch’s t-tests. Fis = Fishing population; Far(S) = Farmers from the South; Far(N) = Farmers from the North; HG = Hunter-gatherers.

References

    1. Greenblum S, Turnbaugh PJ, Borenstein E (2012) Metagenomic systems biology of the human gut microbiome reveals topological shifts associated with obesity and inflammatory bowel disease. Proceedings of the National Academy of Sciences 109: 594–599. - PMC - PubMed
    1. Consortium HMP (2012) Structure, function and diversity of the healthy human microbiome. Nature 486: 207–214. 10.1038/nature11234 - DOI - PMC - PubMed
    1. Petrof EO, Gloor GB, Vanner SJ, Weese SJ, Carter D, et al. (2013) Stool substitute transplant therapy for the eradication of Clostridium difficile infection:‘RePOOPulating’the gut. Microbiome 1: 1–12. - PMC - PubMed
    1. David LA, Maurice CF, Carmody RN, Gootenberg DB, Button JE, et al. (2013) Diet rapidly and reproducibly alters the human gut microbiome. Nature. - PMC - PubMed
    1. Goodrich JK, Waters JL, Poole AC, Sutter JL, Koren O, et al. (2014) Human genetics shape the gut microbiome. Cell 159: 789–799. 10.1016/j.cell.2014.09.053 - DOI - PMC - PubMed

Publication types