. 2016 Jan;19(1):40-7.
doi: 10.1038/nn.4181. Epub 2015 Nov 30.

Mapping DNA methylation across development, genotype and schizophrenia in the human frontal cortex

Affiliations

Mapping DNA methylation across development, genotype and schizophrenia in the human frontal cortex

Andrew E Jaffe et al. Nat Neurosci. 2016 Jan.

Abstract

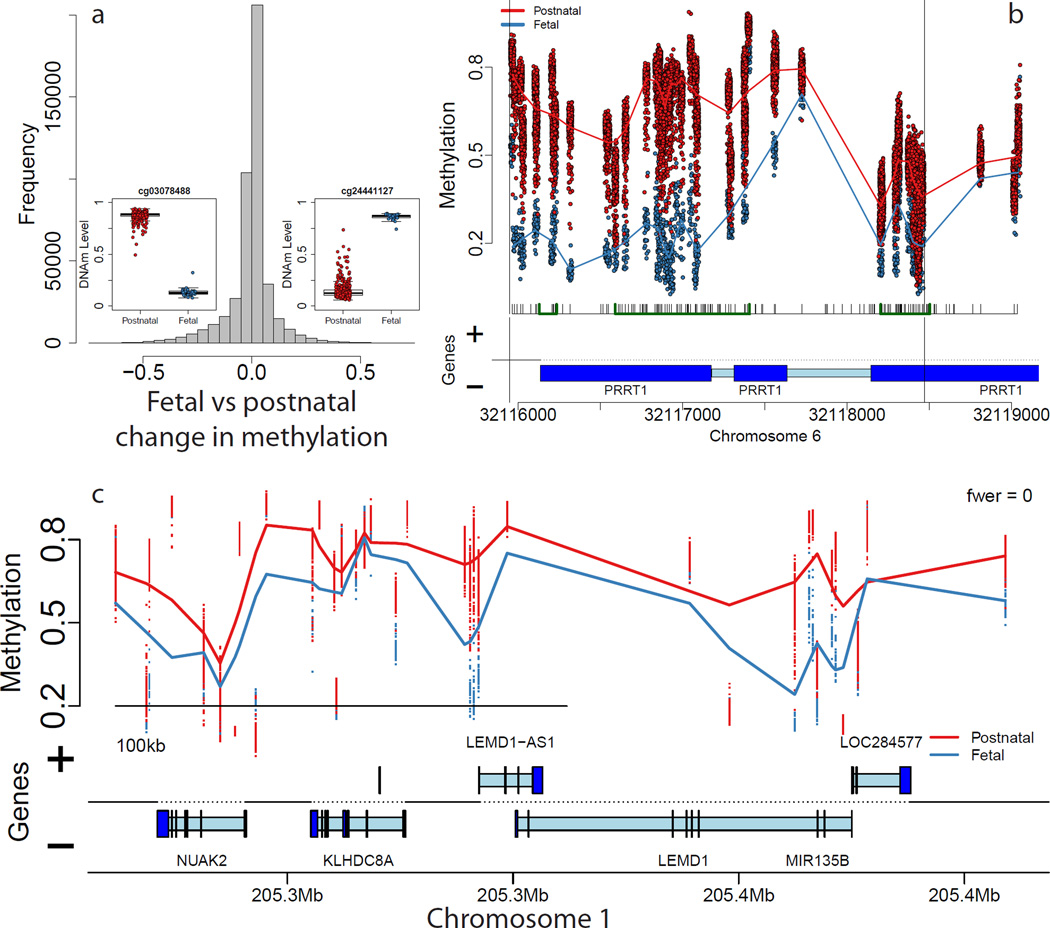
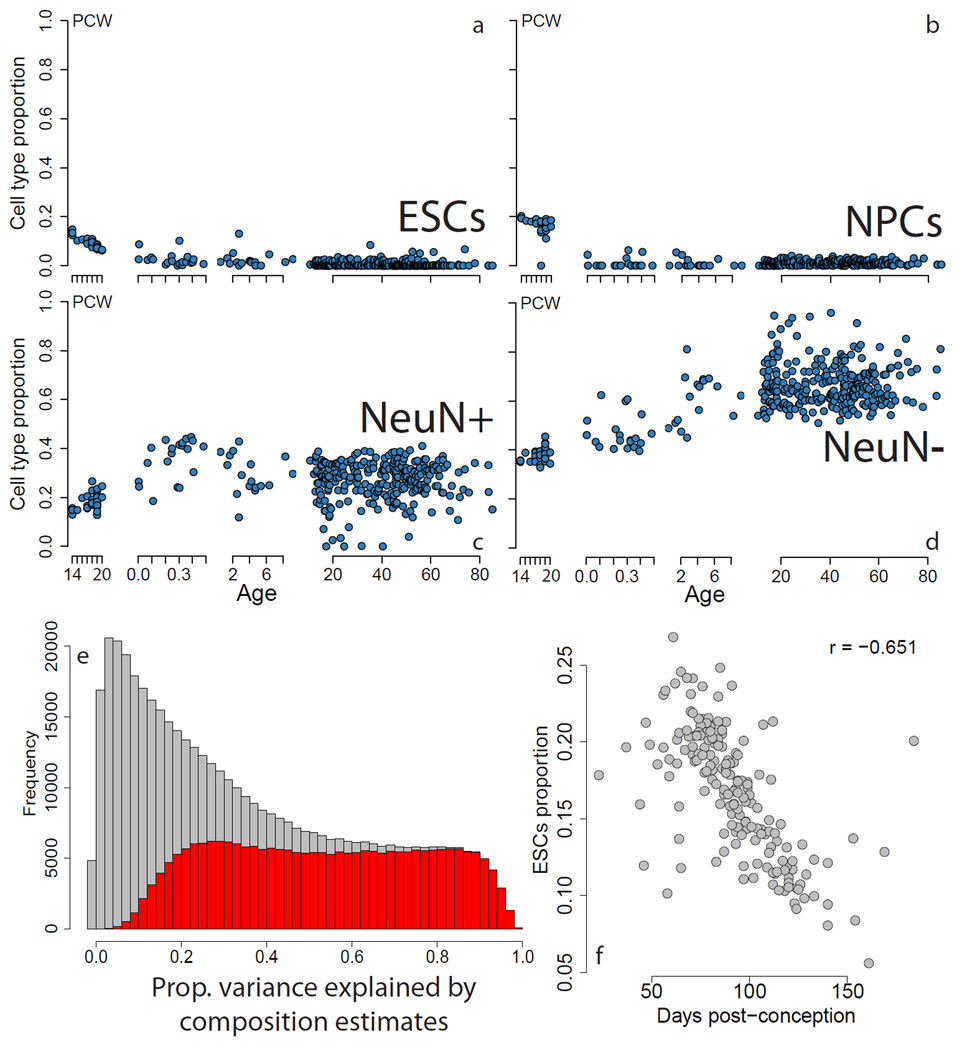
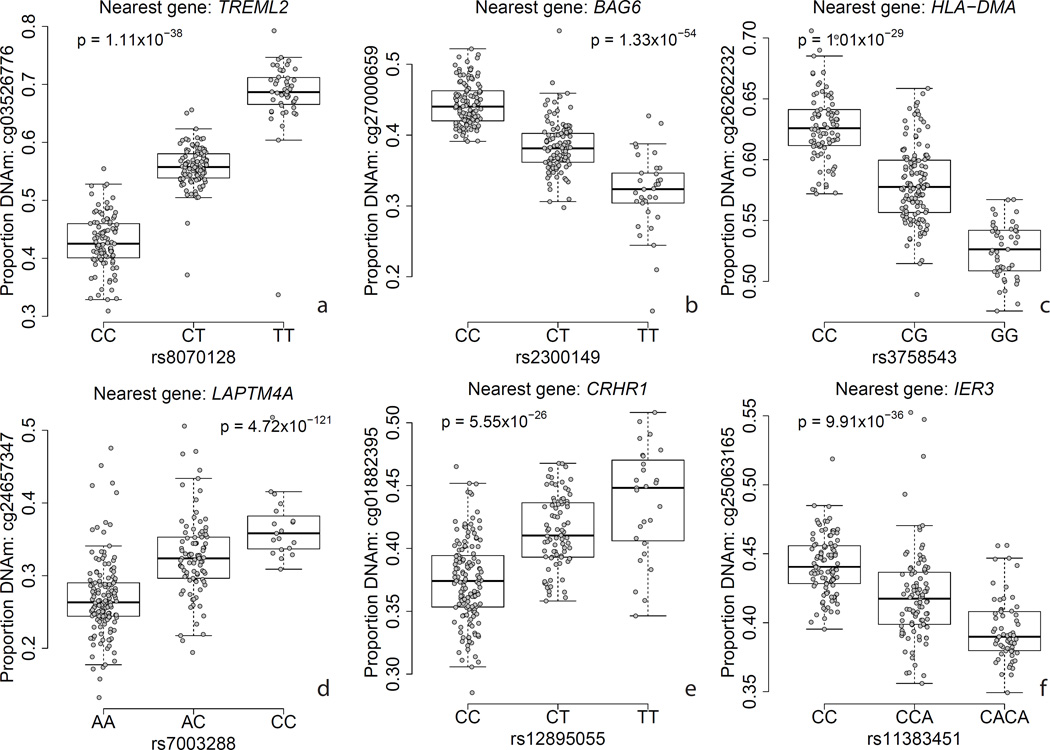
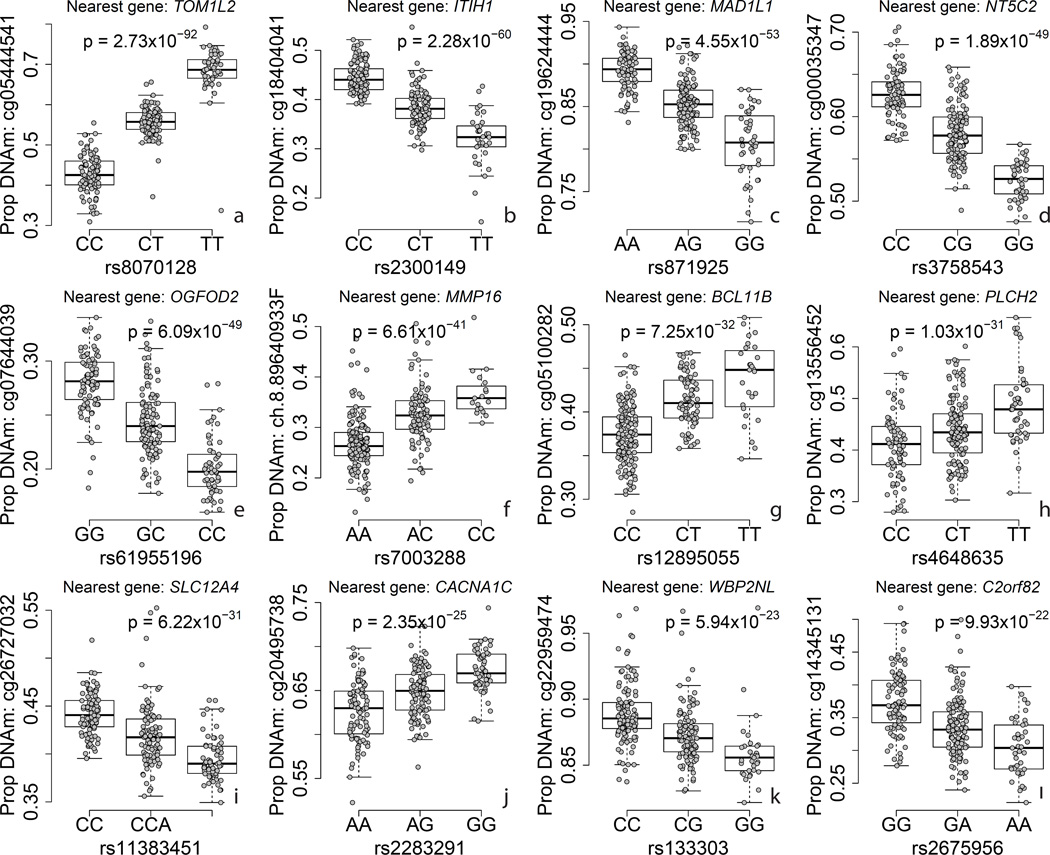
DNA methylation (DNAm) is important in brain development and is potentially important in schizophrenia. We characterized DNAm in prefrontal cortex from 335 non-psychiatric controls across the lifespan and 191 patients with schizophrenia and identified widespread changes in the transition from prenatal to postnatal life. These DNAm changes manifest in the transcriptome, correlate strongly with a shifting cellular landscape and overlap regions of genetic risk for schizophrenia. A quarter of published genome-wide association studies (GWAS)-suggestive loci (4,208 of 15,930, P < 10(-100)) manifest as significant methylation quantitative trait loci (meQTLs), including 59.6% of GWAS-positive schizophrenia loci. We identified 2,104 CpGs that differ between schizophrenia patients and controls that were enriched for genes related to development and neurodifferentiation. The schizophrenia-associated CpGs strongly correlate with changes related to the prenatal-postnatal transition and show slight enrichment for GWAS risk loci while not corresponding to CpGs differentiating adolescence from later adult life. These data implicate an epigenetic component to the developmental origins of this disorder.


Conflict of interest statement

Disclosure Declaration: The authors have declared that no conflicting interests exist.

Figures

Figure 1
Figure 1
Differentially methylated loci comparing pre- and post-natal control subjects show large differences in DNA methylation. (A) Distribution of differences in DNAm across all individual CpGs/probes shows many sites with large changes in DNAm. Insets: examples of differentially methylated loci. (B) An example differentially methylated regions (DMRs) representing regional differences in DNAm levels. (C) An example methylation block representing long range changes. Proportion methylation is shown on the y-axis of the insets in panels B,C and the insets in panel A. Gene annotation panels in (B) and (C) are based on Ensembl annotation – dark blue represents exons and light blue represents introns.
Figure 2
Figure 2
A changing neuronal phenotype across brain development. (A–D) Composition proportions per sample plotted versus age; the first subpanel in each represents age in post-conception weeks, and the remaining 3 subpanels show age in years. (E) Proportion of variance, R2, explained by cell composition at each CpG (grey) where the proportion of CpGs showing significant age stage-related (fetal versus postnatal) changes are shown in red. (F) The estimated proportion of ESCs versus post-conception days from Spiers, et al. shows strong association. ESCs: embryonic stem cells, NPCs: neural progenitor cells, PCW: post-conception weeks.
Figure 3
Figure 3
Examples of methylation quantitative trait loci (meQTLs) for six GWAS-associated variants with nearby DNA methylation levels. Y-axis: DNA methylation level at a particular probe, X-axis: genotype at a particular SNP, p-value corresponds to the effect of genotype on DNAm level, adjusting for ancestry and epigenetic principal components.
Figure 4
Figure 4
Examples of methylation quantitative trait loci (meQTLs) for twelve GWAS-positive loci for schizophrenia. Y-axis: DNA methylation level at a particular probe, X-axis: genotype at a particular SNP, p-value corresponds to the effect of genotype on DNAm level, adjusting for ancestry and epigenetic principal components.

Comment in

References

    1. Colantuoni C, et al. Temporal dynamics and genetic control of transcription in the human prefrontal cortex. Nature. 2011;478:519–523. - PMC - PubMed
    1. Numata S, et al. DNA methylation signatures in development and aging of the human prefrontal cortex. American journal of human genetics. 2012;90:260–272. - PMC - PubMed
    1. Grayson DR, Guidotti A. The dynamics of DNA methylation in schizophrenia and related psychiatric disorders. Neuropsychopharmacology : official publication of the American College of Neuropsychopharmacology. 2013;38:138–166. - PMC - PubMed
    1. Waterland RA, Michels KB. Epigenetic epidemiology of the developmental origins hypothesis. Annual review of nutrition. 2007;27:363–388. - PubMed
    1. Jakovcevski M, Akbarian S. Epigenetic mechanisms in neurological disease. Nature medicine. 2012;18:1194–1204. - PMC - PubMed

Publication types