Clinical Trial
. 2015 Dec 1:5:17610.
doi: 10.1038/srep17610.

Effect of Age and Refractive Error on the Melanopsin Mediated Post-Illumination Pupil Response (PIPR)

Affiliations
Clinical Trial

Effect of Age and Refractive Error on the Melanopsin Mediated Post-Illumination Pupil Response (PIPR)

Prakash Adhikari et al. Sci Rep. .

Abstract

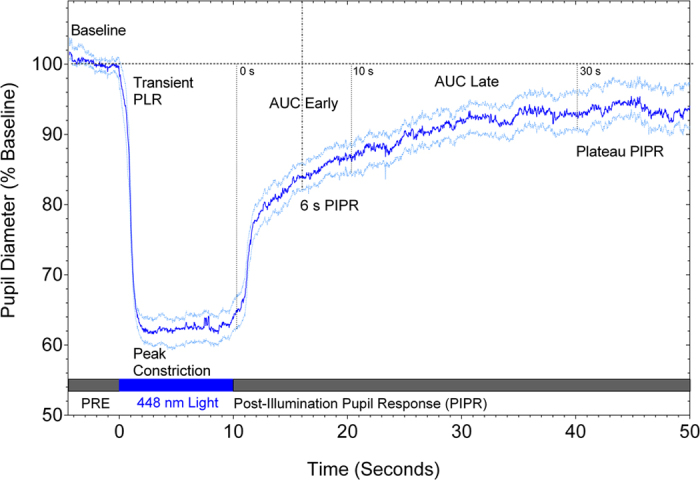
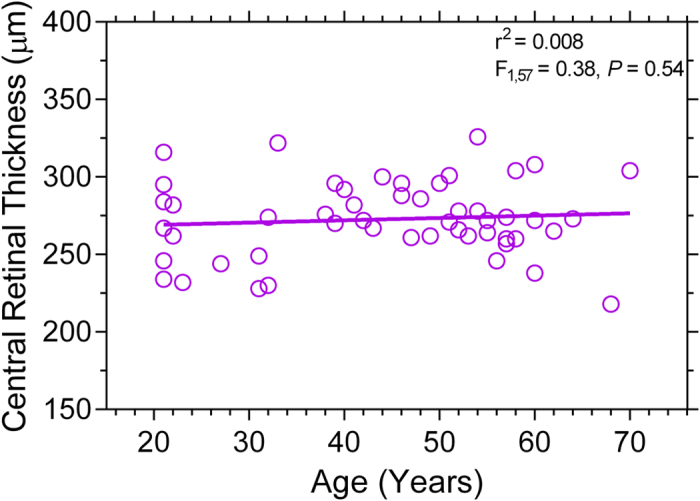
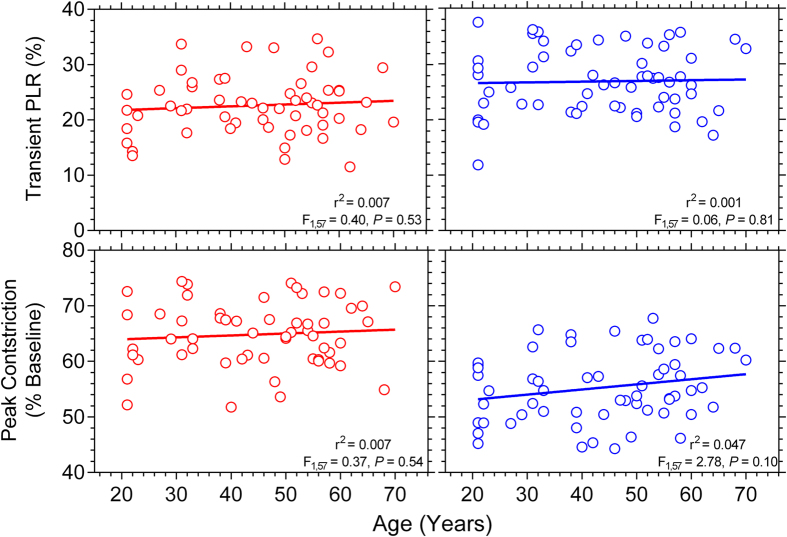
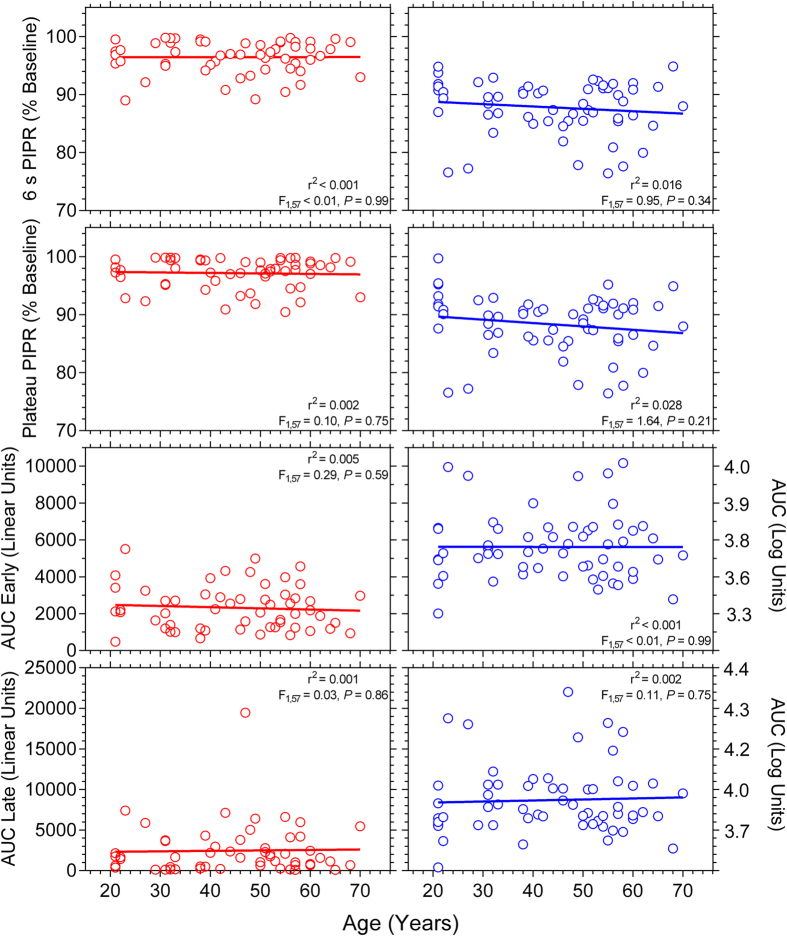
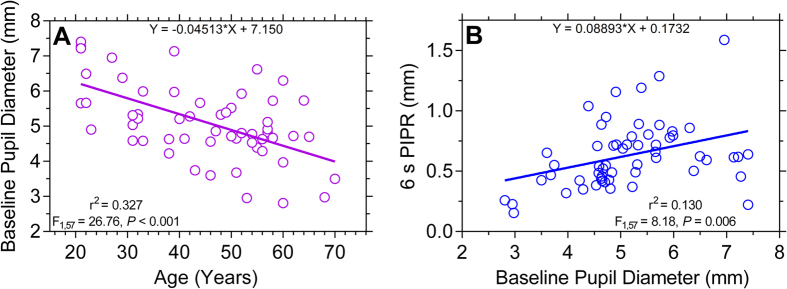
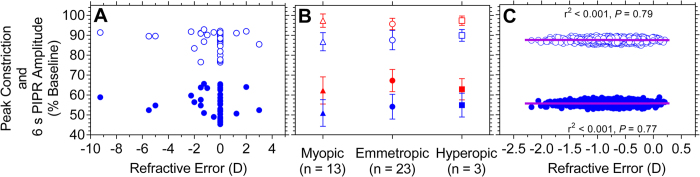
Melanopsin containing intrinsically photosensitive Retinal Ganglion cells (ipRGCs) mediate the pupil light reflex (PLR) during light onset and at light offset (the post-illumination pupil response, PIPR). Recent evidence shows that the PLR and PIPR can provide non-invasive, objective markers of age-related retinal and optic nerve disease; however there is no consensus on the effects of healthy ageing or refractive error on the ipRGC mediated pupil function. Here we isolated melanopsin contributions to the pupil control pathway in 59 human participants with no ocular pathology across a range of ages and refractive errors. We show that there is no effect of age or refractive error on ipRGC inputs to the human pupil control pathway. The stability of the ipRGC mediated pupil response across the human lifespan provides a functional correlate of their robustness observed during ageing in rodent models.


Figures

Figure 1
Figure 1. Stimulus protocol for pupillometry.
Red stimuli (red rectangles) and blue stimuli (blue rectangles) were alternated. The double slash before each 5 s pre-stimulus duration indicates a 10 s interval. Measurements were repeated twice; a two minutes break was given between the repeats of this sequence. PRE = pre-stimulus duration; PIPR = post-illumination pupil response.
Figure 2
Figure 2. Pupil trace showing the average (n = 59 participants; 21–70 years old) pupil light reflex (PLR) during presentation of a 10 s, 448 nm (blue) light pulse (14.5 log quanta.cm−2.s−1; 25° diameter), and the post-illumination pupil response (PIPR) after light offset.
The dark blue trace shows the mean PLR and PIPR and light blue traces show the 95% confidence limits of the mean. The temporal sequence of the pupillometry protocol is indicated by the filled rectangles positioned along the abscissa. The pupil analysis metrics are noted on the trace and defined in Table 1. PRE = pre-stimulus duration; AUC = area under curve.
Figure 3
Figure 3. Relationship between age and the central retinal thickness (n = 59 participants).
The solid line indicates the best-fitting linear regression. The F-value indicates the slope of the regression line does not change as a function of age.
Figure 4
Figure 4. Relationship between age and the transient PLR (upper panels) and peak pupil constriction (lower panels) (n = 59 participants).
The red and blue circles indicate the response with red and blue lights, respectively; and the solid lines show the best-fitting linear regressions. The F-values indicate the slopes of the regression lines do not change as a function of age.
Figure 5
Figure 5. Relationship between age and the PIPR metrics (6 s PIPR, Plateau PIPR, AUC Early, and AUC Late recovery) (n = 59 participants).
The red and blue circles indicate the response with red and blue lights, respectively; and the solid lines show the best-fitting linear regressions. The F-values indicate the slopes of the regression lines do not change as a function of age.
Figure 6
Figure 6. Relationship between the baseline pupil diameter (mm) and age (Panel (A)) and the 6 s PIPR (Panel (B)) (n = 59 participants).
The 6 s PIPR is given in mm (not % baseline as in the other figures) and a larger value indicates a larger PIPR. The F-values indicate the slopes of the regression lines are significantly different from zero.
Figure 7
Figure 7. Panel (A) Scatterplot showing the peak pupil constriction (filled blue circles) and 6 s PIPR amplitude (open blue circles) for blue light as a function of refractive error (spherical equivalent, Dioptre, D).
Panel (B): Median ± SD peak pupil constriction (filled symbols) and 6 s PIPR amplitude (open symbols) with red (red symbols) and blue (blue symbols) light pulses for myopes (triangles), emmetropes (circles), and hyperopes (squares). Panel (C): Scatterplot showing the bootstrapped estimates (B = 1560) of the data in Panel A; the solid lines indicate the best-fitting linear regressions.
Figure 8
Figure 8. Mean ± SD (n = 59 participants) intra- and inter-individual Coefficient of Variation (CV) of the PIPR metrics with blue light; red light showed similar results (not shown).

References

    1. Provencio I. et al. A novel human opsin in the inner retina. J. Neurosci. 20, 600–605 (2000). - PMC - PubMed
    1. Dacey D. M. et al. Melanopsin-expressing ganglion cells in primate retina signal colour and irradiance and project to the LGN. Nature 433, 749–754 (2005). - PubMed
    1. Gamlin P. D. et al. Human and macaque pupil responses driven by melanopsin-containing retinal ganglion cells. Vision Res. 47, 946–954 (2007). - PMC - PubMed
    1. McDougal D. H. & Gamlin P. D. The influence of intrinsically-photosensitive retinal ganglion cells on the spectral sensitivity and response dynamics of the human pupillary light reflex. Vision Res. 50, 72–87 (2010). - PMC - PubMed
    1. Berson D. M., Dunn F. A. & Takao M. Phototransduction by retinal ganglion cells that set the circadian clock. Science 295, 1070–1073 (2002). - PubMed

Publication types