. 2016 Mar;174(3):251-9.
doi: 10.1530/EJE-15-0674. Epub 2015 Nov 30.

Reduced β-cell function in early preclinical type 1 diabetes

Affiliations

Reduced β-cell function in early preclinical type 1 diabetes

Maarit K Koskinen et al. Eur J Endocrinol. 2016 Mar.

Abstract

Objective: We aimed to characterize insulin responses to i.v. glucose during the preclinical period of type 1 diabetes starting from the emergence of islet autoimmunity.

Design and methods: A large population-based cohort of children with HLA-conferred susceptibility to type 1 diabetes was observed from birth. During regular follow-up visits islet autoantibodies were analysed. We compared markers of glucose metabolism in sequential intravenous glucose tolerance tests between 210 children who were positive for multiple (≥2) islet autoantibodies and progressed to type 1 diabetes (progressors) and 192 children testing positive for classical islet-cell antibodies only and remained healthy (non-progressors).

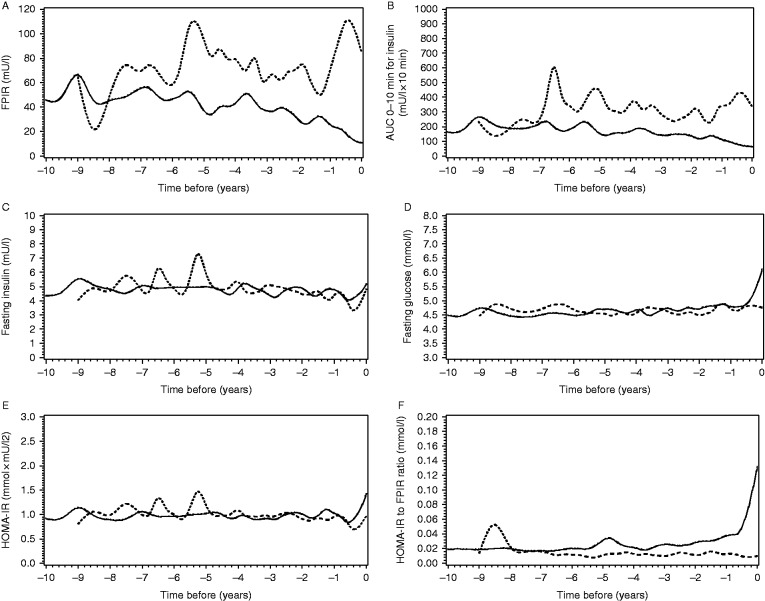
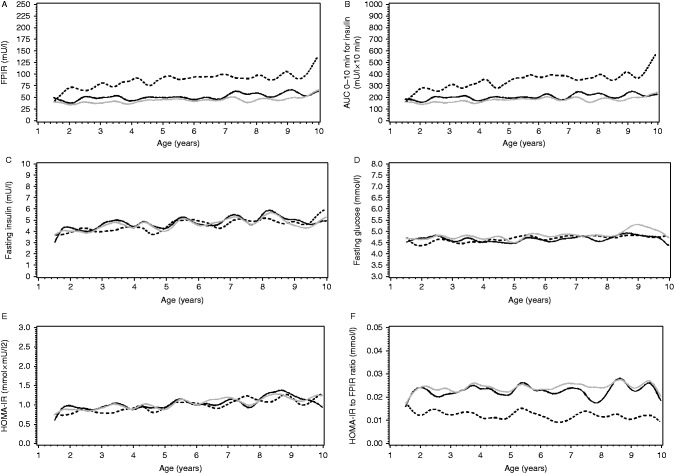
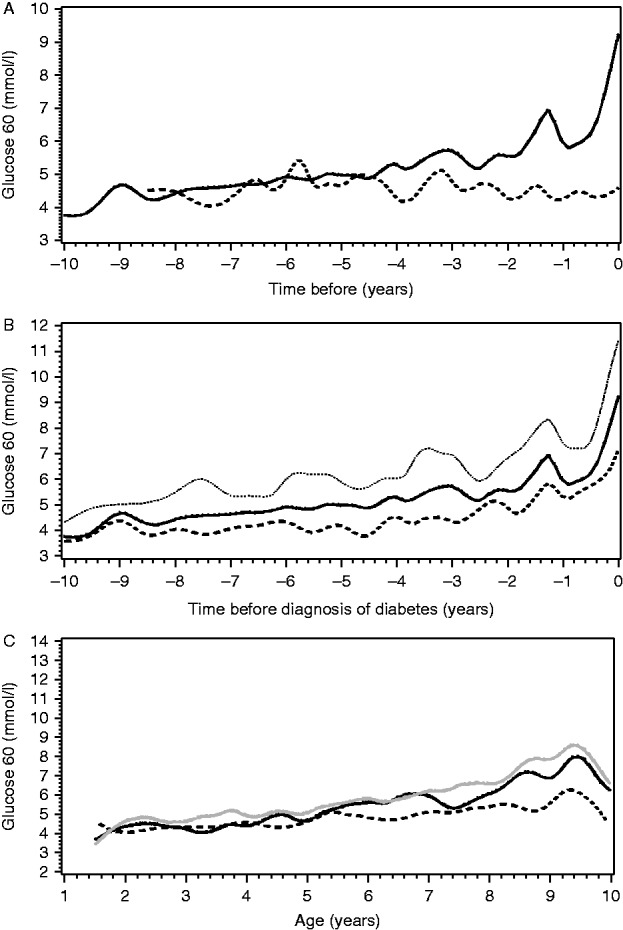
Results: In the progressors, the first phase insulin response (FPIR) was decreased as early as 4-6 years before the diagnosis when compared to the non-progressors (P=0.001). The difference in FPIR between the progressors and non-progressors was significant (P<0.001) in all age groups, increasing with age (at 2 years: difference 50% (95% CI 28-75%) and at 10 years: difference 172% (95% CI 128-224%)). The area under the 10-min insulin curve showed a similar difference between the groups (P<0.001; at 2 years: difference 36% (95% CI 17-58%) and at 10 years: difference 186% (95% CI 143-237%)). Insulin sensitivity did not differ between the groups.

Conclusions: FPIR is decreased several years before the diagnosis of type 1 diabetes, implying an intrinsic defect in β-cell mass and/or function.


Figures

Figure 1
Figure 1
Median values of the study variables ((A) FPIR, (B) AUC0–10 min for insulin, (C) fasting insulin, (D) fasting glucose, (E) HOMA-IR index and (F) HOMA-IR to FPIR ratio) before the diagnosis of type 1 diabetes in the progressors (black line) and in the non-progressors until the last IVGTT (dotted line). Point 0 indicates the time of the diagnosis or the last IVGTT. The x axis indicates years before the diagnosis or the last IVGTT. (A and B) The y axis indicates the unit for the study variable. FPIR and AUC0–10 min for insulin were decreased 0–2 and 2–4 years (P<0.001 for both variables and time periods) and up to the time period of 4–6 years before the diagnosis as compared to the non-progressors (P=0.001 and P=0.002 respectively). (C) Fasting insulin did not differ between the groups before the diagnosis. (D) Fasting glucose differed between the groups 0–2 years before the diagnosis (P=0.008). (E) HOMA-IR index did not differ between the groups before the diagnosis. (F) HOMA-IR to FPIR ratio was increased in the progressors during the time periods 0–2, 2–4 and 4–6 years prior to diagnosis (P<0.001, P<0.001 and P=0.005 respectively).
Figure 2
Figure 2
Mean values of the study variables ((A) FPIR, (B) AUC0–10 min for insulin, (C) fasting insulin, (D) fasting glucose, (E) HOMA-IR index and (F) HOMA-IR to FPIR ratio) in cubic splines between the non-progressors and progressors as a function of age (years). The solid line shows the values of the progressors. The black line represents the values when the last 2 years prior to diagnosis were excluded. The grey line represents the values when the last 2 years prior to diagnosis were included. The black dotted line represents the non-progressors. (C, D and E) Fasting insulin increased 3.9%/year, fasting glucose 0.50%/year and HOMA-IR index increased 4.4%/year (P<0.001, P=0.0024 and P<0.001 respectively).
Figure 3
Figure 3
(A) Median 60-min values of glucose before the diagnosis of type 1 diabetes in the progressors (black line) and in the non-progressors until the last IVGTT (dotted line). Point 0 indicates the time of the diagnosis or the last IVGTT. The x axis indicates years before the diagnosis or the last IVGTT. The y axis indicates plasma glucose concentration at 60 minutes. (B) The median, upper and lower quartile for 60-min glucose values before the diagnosis of type 1 diabetes. Point 0 indicates the time of diagnosis. The x axis indicates years before the diagnosis. The y axis indicates plasma glucose concentration at 60 minutes. For other variables in this study, the quartiles before the diagnosis of type 1 diabetes are seen in the Supplementary File. (C) Mean values of glucose at 60 min in cubic splines among the non-progressors and progressors as a function of age (years). The solid line shows the values of the progressors. The black line represents the values when the last 2 years prior to diagnosis were excluded. The grey line represents the values when the last 2 years prior to diagnosis were included. The black dotted line represents the non-progressors. Glucose values at 60 min were obtained from the Turku data set (299 samples from non-progressors and 325 samples from progressors).

References

    1. Atkinson MA, Eisenbarth GS, Michels AW. Type 1 diabetes. Lancet. 2014;383:69–82. doi: 10.1016/S0140-6736(13)60591-7. - DOI - PMC - PubMed
    1. Kimpimäki T, Kupila A, Hämäläinen AM, Kukko M, Kulmala P, Savola K, Simell T, Keskinen P, Ilonen J, Simell O, et al. The first signs of β-cell autoimmunity appear in infancy in genetically susceptible children from the general population: the Finnish Type 1 Diabetes Prediction and Prevention Study. Journal of Clinical Endocrinology and Metabolism. 2001;10:4782–4788. doi: 10.1210/jcem.86.10.7907. - DOI - PubMed
    1. Parikka V, Näntö-Salonen K, Saarinen M, Simell T, Ilonen J, Hyöty H, Veijola R, Knip M, Simell O. Early seroconversion and rapidly increasing autoantibody concentrations predict prepubertal manifestation of type 1 diabetes in children at genetic risk. Diabetologia. 2012;7:1926–1936. doi: 10.1007/s00125-012-2523-3. - DOI - PubMed
    1. Ziegler AG, Bonifacio E, BABYDIAB-BABYDIET Study Group Age-related islet autoantibody incidence in offspring of patients with type 1 diabetes. Diabetologia. 2012;7:1937–1943. doi: 10.1007/s00125-012-2472-x. - DOI - PubMed
    1. Patterson CC, Dahlquist GG, Gyurus E, Green A, Soltesz G, EURODIAB Study Group Incidence trends for childhood type 1 diabetes in Europe during 1989–2003 and predicted new cases 2005–20: a multicentre prospective registration study. Lancet. 2009;373:2027–2033. doi: 10.1016/S0140-6736(09)60568-7. - DOI - PubMed

Publication types

MeSH terms