. 2015 Dec 1:6:10043.
doi: 10.1038/ncomms10043.

Branched-chain amino acid catabolism is a conserved regulator of physiological ageing

Affiliations

Branched-chain amino acid catabolism is a conserved regulator of physiological ageing

Johannes Mansfeld et al. Nat Commun. .

Abstract

Ageing has been defined as a global decline in physiological function depending on both environmental and genetic factors. Here we identify gene transcripts that are similarly regulated during physiological ageing in nematodes, zebrafish and mice. We observe the strongest extension of lifespan when impairing expression of the branched-chain amino acid transferase-1 (bcat-1) gene in C. elegans, which leads to excessive levels of branched-chain amino acids (BCAAs). We further show that BCAAs reduce a LET-363/mTOR-dependent neuro-endocrine signal, which we identify as DAF-7/TGFβ, and that impacts lifespan depending on its related receptors, DAF-1 and DAF-4, as well as ultimately on DAF-16/FoxO and HSF-1 in a cell-non-autonomous manner. The transcription factor HLH-15 controls and epistatically synergizes with BCAT-1 to modulate physiological ageing. Lastly and consistent with previous findings in rodents, nutritional supplementation of BCAAs extends nematodal lifespan. Taken together, BCAAs act as periphery-derived metabokines that induce a central neuro-endocrine response, culminating in extended healthspan.


Figures

Figure 1
Figure 1. Sample acquisition and data processing scheme of the trans-species screening approach.
RNAs of each sample were sequenced. After passing quality control and sample clustering, the sequences were mapped to the referring genome. The number of reads of the resulting annotated genes were used for statistical evaluation. Commonly regulated genes over the three species were subsequently tested individually for putative impact on lifespan in C. elegans.
Figure 2
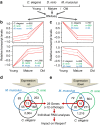
Figure 2. A trans-species screening approach to identify ageing-associated genes.
(a) Depicts species subjected to RNA extraction at three different ages. (b) Depicts relative RNA transcript levels uniformly upregulated during physiological ageing. (c) Depicts relative RNA transcript levels uniformly downregulated during physiological ageing. (d,e) Show results of Venn analysis from genes identified in b and c, respectively. C. elegans results are shown in black, D. rerio in green and M. musculus in blue.
Figure 3
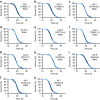
Figure 3. Lifespan analyses in C. elegans for validation of impact on ageing with significantly increased lifespan (≥5%).
(ak) depict lifespan assays following RNAi treatment during adult life with control vector (black) or RNAi against the respective gene (blue) starting at L4 larvae stage. For P-values and number of experiments see Supplementary Table 2. Note that results for bcat-1 have been omitted since shown subsequently.
Figure 4
Figure 4. Lifespan analyses in C. elegans for validation of impact on ageing with significantly increased lifespan (<5%).
(ai) depict lifespan assays following RNAi treatment during adult life with control vector (black) or RNAi against the respective gene (blue) starting at L4 larvae stage. For P-values and number of experiments see Supplementary Table 2.
Figure 5
Figure 5. Lifespan analyses in C. elegans for validation of impact on ageing with no significant effect on lifespan.
(ak) depict lifespan assays following RNAi treatment during adult life with control vector (black) or RNAi against the respective gene (blue) starting at L4 larvae stage. For P-values and number of experiments see Supplementary Table 2.
Figure 6
Figure 6. Lifespan analyses in C. elegans for validation of impact on ageing with significantly shortened lifespan.
(ai) depict lifespan assays following RNAi treatment during adult life with control vector (black) or RNAi against the respective gene (blue) starting at L4 larvae stage. For P-values and number of experiments see Supplementary Table 2.
Figure 7
Figure 7. Validation and characterization of bcat-1 as an ageing-related gene.
(a) Shows bcat-1 RNA levels in whole-worm RNA extracts after treatment of C. elegans with RNAi against bcat-1 (red bar) versus control RNAi (open bar; P<0.001, Student's t-test, n=3). (b) Depicts the effect of bcat-1 RNAi (red) versus control (black) on lifespan (P<0.0001, log-rank test, n=3). (c) Depicts qPCR results (grey) in comparison with RNA-seq results (black; samples as depicted in Fig. 1c; P<0.05 versus first time point; one-way ANOVA, n=3). (d) shows a Venn analysis of transcripts that are regulated by physiological ageing (blue) and bcat-1 RNAi treatment (red), respectively. (e) Shows transcript levels as in d quantitatively (P<0.001, correlation, n=3). (fl) Depict bcat-1 RNAi-treated (red) versus control (open) nematodes regarding (f) ageing pigments (P<0.001, Student's t-test, n=8), (g) progeny (P=0.7, Student's t-test, n=10), (h) maximum crawling speed (P<0.05, Student's t-test, n=5), as well as changes in whole-worm amino acid concentrations as determined by (i) HPLC (*P<0.05, **P<0.01, ***P<0.001 versus control, one-way ANOVA, n=4), and (j) mass spectrometry (*P<0.05, **P<0.01, ***P<0.001 versus control, one-way ANOVA, n=4). Error bars represent the means±s.d.
Figure 8
Figure 8. Increased BCAAs act through neuronal LET-363/mTOR and peripheral DAF-7/TGFβ signaling to extend lifespan.
(a) Shows lifespan data of wild-type nematodes without treatment (black), as well as, exposure to L-alanine (grey, 5 mM) and L-leucine (blue, 5 mM) for their entire adult lifespan, maintained on non-metabolizing bacteria (P=0.24 for L-ala and P<0.0001 for L-leu both versus control, log-rank test, n=3). (b,c) Show effects of bcat-1 RNAi (red) on lifespan in strains mutant for (b) hsf-1 (P=0.67, log-rank test, n=3) and (c) daf-16 (P<0.001, log-rank test, n=3). (d) Depicts the effects of the mTOR-inhibitor rapamycin (100 μM) on wild-type worms (grey versus black) versus the lack of effect of non-neuronal bcat-1 RNAi in the presence of rapamycin (100 μM), all on lifespan (P<0.05 for control RNAi/rapamycin versus control RNAi/DMSO, P=0.07 for bcat-1 RNAi/rapamycin versus control RNAi/rapamycin, P<0.0001 for bcat-1 RNAi/rapamycin versus bcat-1 RNAi/DMSO, P<0.0001 for bcat-1 RNAi/DMSO versus control RNAi/DMSO, log-rank test, n=3). (e) Depicts the effects of neuronal bcat-1 RNAi on lifespan in the presence (purple) and absence (red) of neuronal RNAi against let-363/mTOR (P=45 for control/let-363 RNAi versus control RNAi, P<0.05 for control/let-363 RNAi versus let-363/bcat-1 RNAi, P<0.0001 for control/bcat-1 RNAi versus let-363/bcat-1 RNAi, P<0.0001 for control RNAi versus control/bcat-1 RNAi, log-rank test, n=3). (f,g) Depict the lack of effect of (f) peripheral bcat-1 RNAi (P=0.73, log-rank test, n=3) and (g) L-leucine supplementation (P=0.96, log-rank test, n=3) on an ASI-ablated reporter strain. (hj) Show the lack of effect of bcat-1 RNAi on strains mutant for (h) daf-7 (P=0.15, log-rank test, n=3) and (i) daf-1 (P=0.84, log-rank test, n=3), as well (j) in the co-presence (purple) or absence (red) of RNAi against daf-4 (P=0.8 for control/bcat-1 RNAi versus daf-4/bcat-1 RNAi, P<0.0001 for all treatments versus control, log-rank test, n=3). For P-values and number of repetitions see Supplementary Table 4.
Figure 9
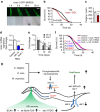
Figure 9. Transcriptional control of bcat-1-mediated regulation of lifespan.
(a) Fluorescent microscopy of nematodes transgenically expressing bcat-1 fused to GFP under the control of the endogenous bcat-1 promoter, at different ages (scale bar, 100 μm). (b) Shows the effect of bcat-1 overexpression on lifespan (P<0.001, log-rank test, n=3). (c) Depicts fertility as reflected by the number of eggs (***P<0.001, Students's t-test, n=10). (d) Depicts transcript levels of bcat-1 in the presence of control RNAi (white), RNAi against hlh-15 (blue) and bcat-1 (red) in wild-type nematodes (***P<0.001, ****P<0.0001 versus control, one-way ANOVA, n=4). (e) Shows transcript levels of bcat-1 (black) and hlh-15 (grey) during physiological ageing in wild-type worms (*P<0.05, one-way ANOVA, Pearson correlation Fisher Z, P=0.053, n=3). (f) Depicts the effects of control RNAi (black), control RNAi combined with bcat-1 RNAi (red; P<0.0001 versus control, log-rank test, n=3), control RNAi combined with hlh-15 RNAi (blue; P<0.0001 versus control, log-rank test, n=3) and bcat-1 RNAi combined with hlh-15 RNAi (purple, epistasis; P<0.0001 versus control, P=0.08 versus control/bcat-1 RNAi, log-rank test, n=3) on C. elegans lifespan. (g) Summarizes the effects of hlh-15-controlled bcat-1 expression, or BCAA supplementation, on neuronal let-363/daf-7 signaling looping back to the periphery to control lifespan. For P-values and number of repetitions see Supplementary Table 4. Error bars represent the means±s.d.

References

    1. McCay C. M., Crowel M. F. & Maynard L. A. The effect of retarded growth upon the length of the life span and upon ultimate body size. J. Nutr. 10, 63–79 (1935). - PubMed
    1. Klass M. R. A method for the isolation of longevity mutants in the nematode Caenorhabditis elegans and initial results. Mech. Ageing Dev. 22, 279–286 (1983). - PubMed
    1. Kirkwood T. B. & Melov S. On the programmed/non-programmed nature of ageing within the life history. Curr. Biol. 21, R701–R707 (2011). - PubMed
    1. Gems D. What is an anti-aging treatment? Exp. Gerontol. 58C, 14–18 (2014). - PubMed
    1. Johnson T. E. Increased life-span of age-1 mutants in Caenorhabditis elegans and lower Gompertz rate of aging. Science 249, 908–912 (1990). - PubMed

Publication types

MeSH terms

Substances