

Diagnostic accuracy of body mass index to identify obesity in older adults: NHANES 1999-2004
- PMID: 26620887
- PMCID: PMC4854777
- DOI: 10.1038/ijo.2015.243
Diagnostic accuracy of body mass index to identify obesity in older adults: NHANES 1999-2004
Abstract
Background: Body composition changes with aging lead to increased adiposity and decreased muscle mass, making the diagnosis of obesity challenging. Conventional anthropometry, including body mass index (BMI), while easy to use clinically may misrepresent adiposity. We determined the diagnostic accuracy of BMI using dual-energy X-ray absorptiometry (DEXA) in assessing the degree of obesity in older adults.
Methods: The National Health and Nutrition Examination Surveys 1999-2004 were used to identify adults aged ⩾60 years with DEXA measures. They were categorized (yes/no) as having elevated body fat by gender (men: ⩾25%; women ⩾35%) and by BMI ⩾25 and ⩾30 kg m(-)(2). The diagnostic performance of BMI was assessed. Metabolic characteristics were compared in discordant cases of BMI/body fat. Weighting and analyses were performed per NHANES (National Health and Nutrition Examination Survey) guidelines.
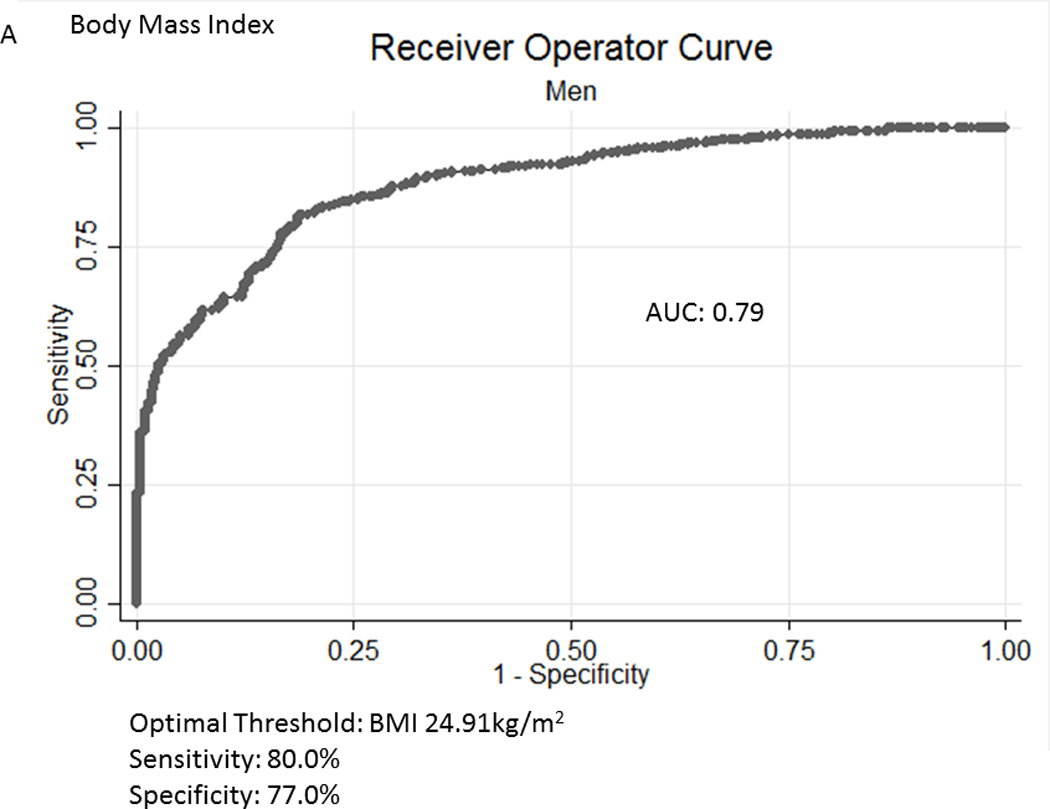
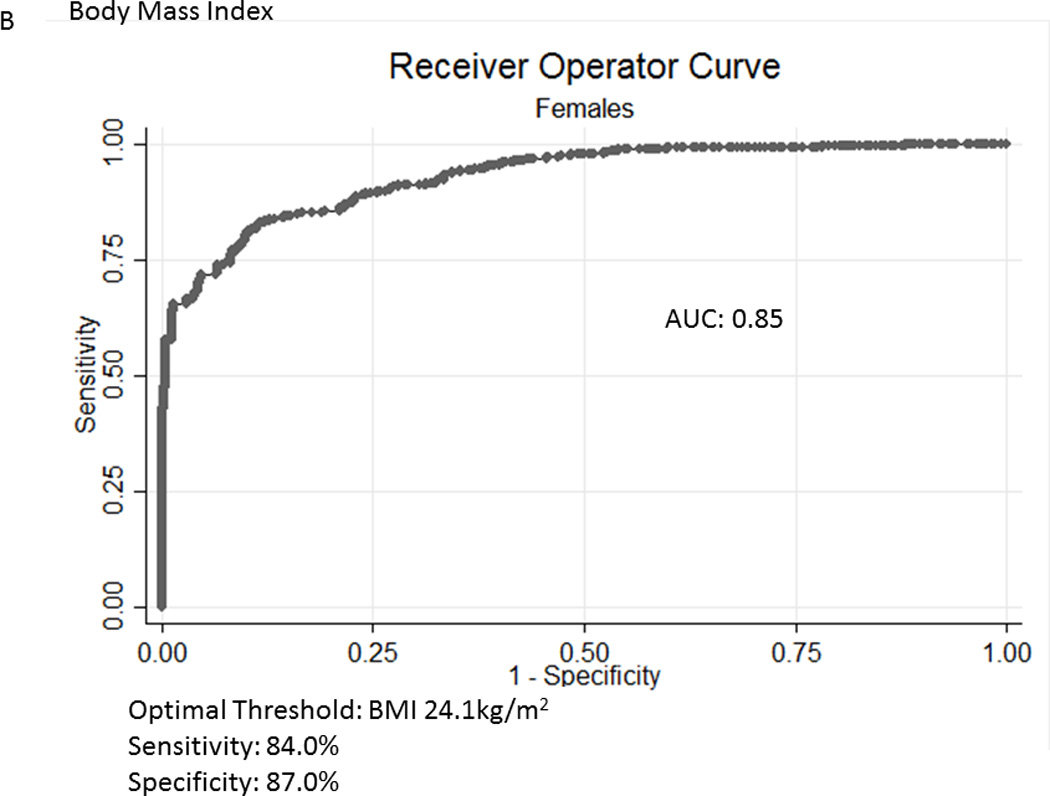
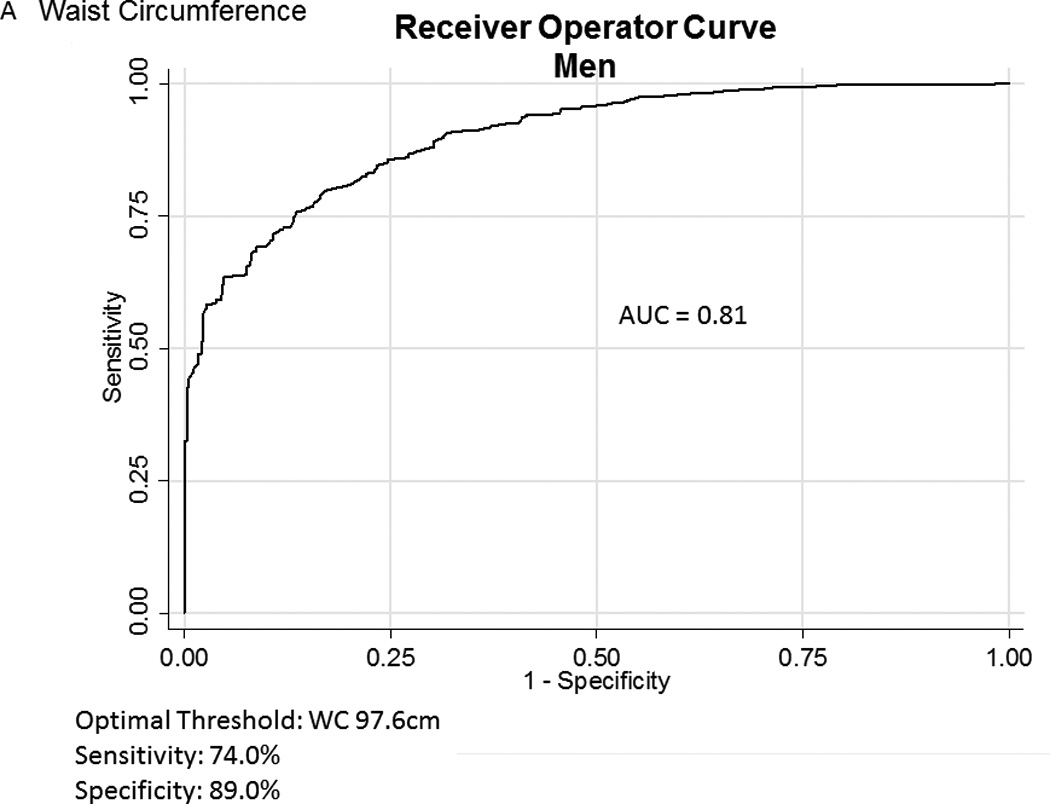
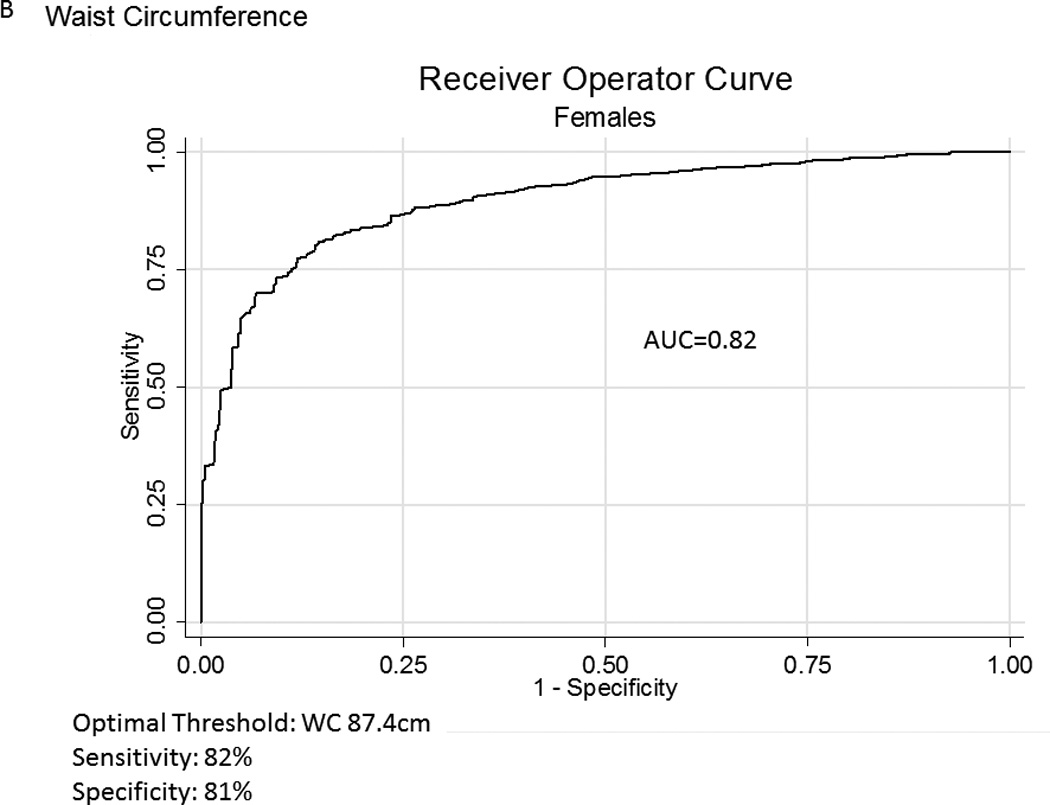
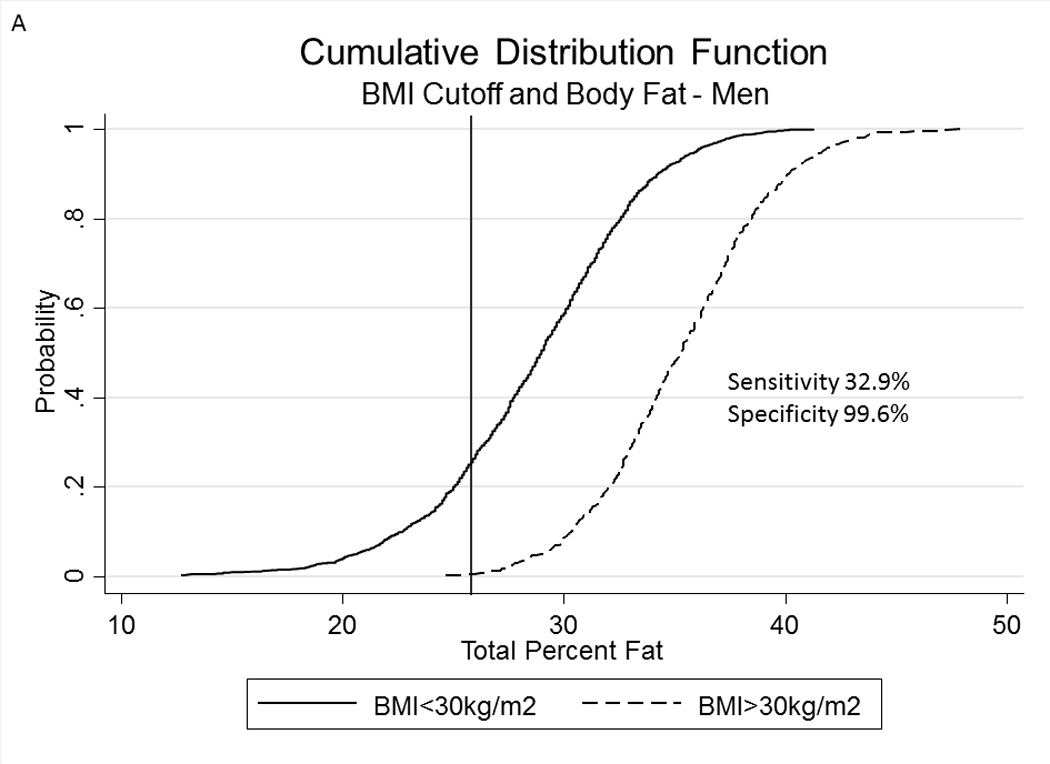
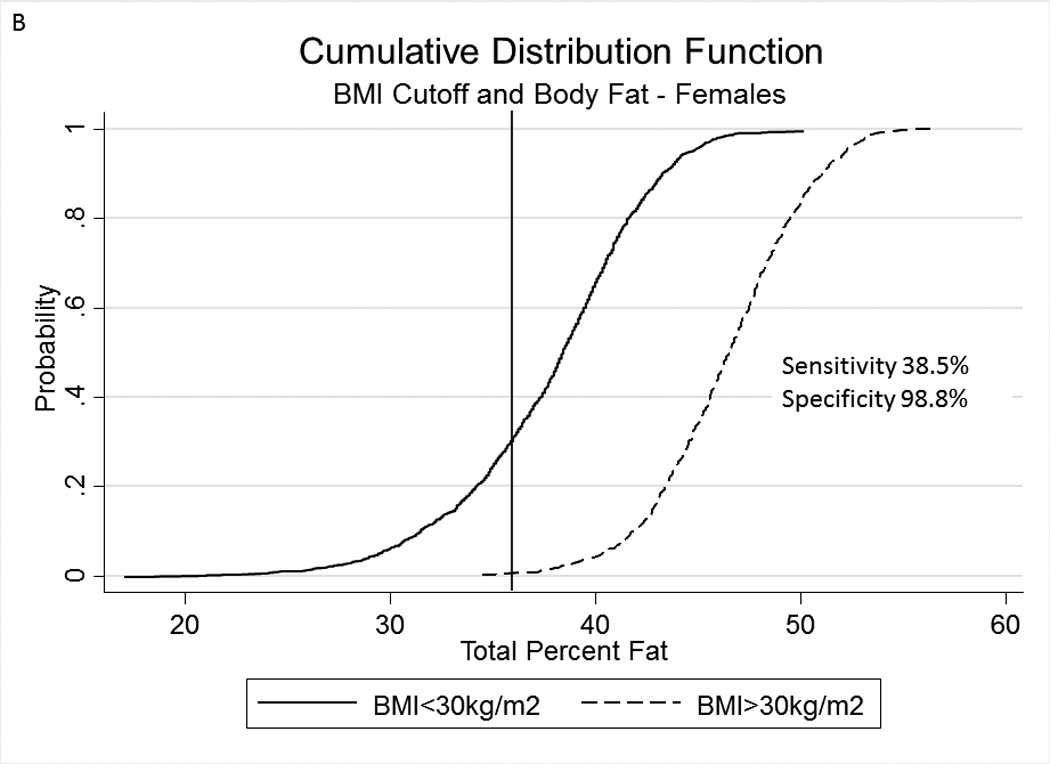
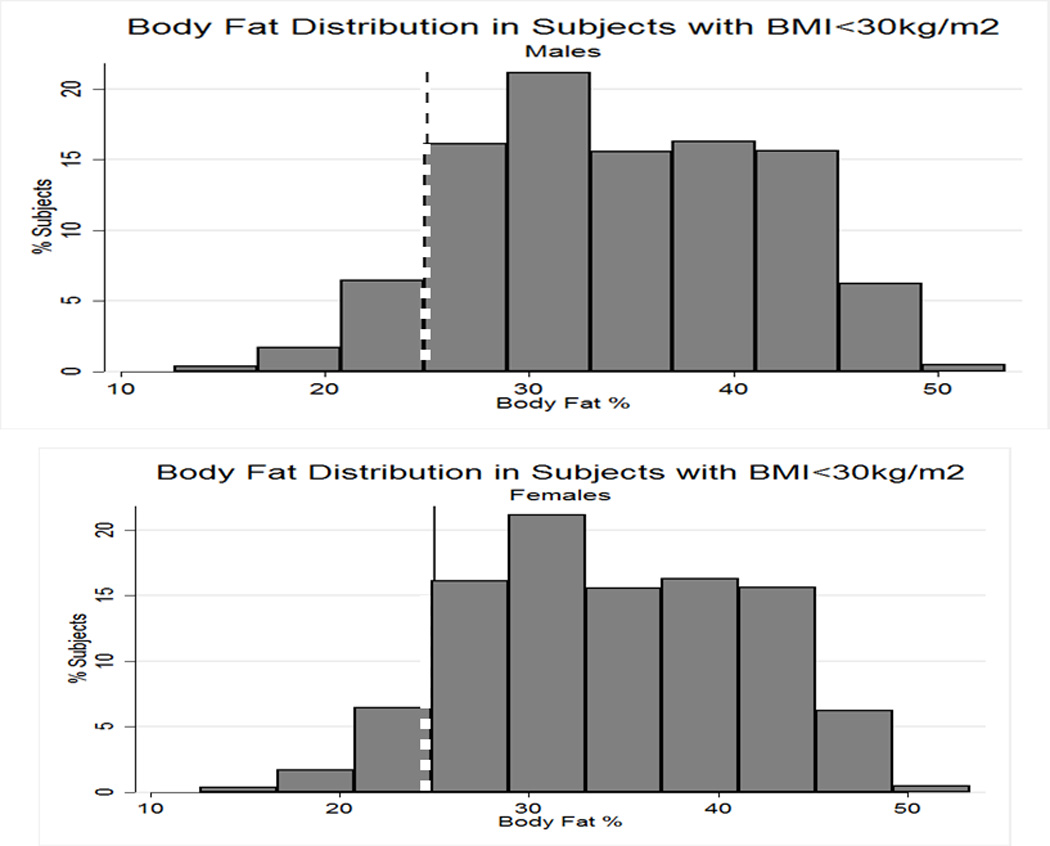
Results: We identified 4984 subjects (men: 2453; women: 2531). Mean BMI and % body fat was 28.0 kg m(-2) and 30.8% in men, and 28.5 kg m(-)(2) and 42.1% in women. A BMI ⩾30 kg m(-)(2) had a low sensitivity and moderately high specificity (men: 32.9 and 80.8%, concordance index 0.66; women: 38.5 and 78.5%, concordance 0.69) correctly classifying 41.0 and 45.1% of obese subjects. A BMI ⩾25 kg m(-2) had a moderately high sensitivity and specificity (men: 80.7 and 99.6%, concordance 0.81; women: 76.9 and 98.8%, concordance 0.84) correctly classifying 80.8 and 78.5% of obese subjects. In subjects with BMI <30 kg m(-)(2), body fat was considered elevated in 67.1% and 61.5% of men and women, respectively. For a BMI ⩾30 kg m(-)(2), sensitivity drops from 40.3% to 14.5% and 44.5% to 23.4%, whereas specificity remains elevated (>98%), in men and women, respectively, in those 60-69.9 years to subjects aged ⩾80 years. Correct classification of obesity using a cutoff of 30 kg m(-)(2) drops from 48.1 to 23.9% and 49.0 to 19.6%, in men and women in these two age groups.
Conclusions: Traditional measures poorly identify obesity in the elderly. In older adults, BMI may be a suboptimal marker for adiposity.
Conflict of interest statement
There are no conflicts of interest pertaining to this manuscript
Figures
References
-
- Flegal KM, Graubard BI, Williamson DF, Gail MH. Excess deaths associated with underweight, overweight, and obesity. JAMA. 2005;293(15):1861–1867. - PubMed
-
- Gregg EW, Cheng YJ, Cadwell BL, Imperatore G, Williams DE, Flegal KM, et al. Secular trends in cardiovascular disease risk factors according to body mass index in US adults. JAMA. 2005;293(15):1868–1874. - PubMed
-
- Jensen MD, Ryan DH, Apovian CM, Ard JD, Comuzzie AG, Donato KA, et al. 2013 AHA/ACC/TOS Guideline for the Management of Overweight and Obesity in Adults: A Report of the American College of Cardiology/American Heart Association Task Force on Practice Guidelines and The Obesity Society. Circulation. 2013 - PubMed
-
- Batsis JA, Sahakyan KR, Rodriguez-Escudero JP, Bartels SJ, Somers VK, Lopez-Jimenez F. Normal weight obesity and mortality in United States subjects >/=60 years of age (from the Third National Health and Nutrition Examination Survey) Am J Cardiol. 2013;112(10):1592–1598. - PubMed
Publication types
MeSH terms
Grants and funding
LinkOut - more resources
Full Text Sources
Other Literature Sources
Medical
