. 2015 Dec 1:5:17625.
doi: 10.1038/srep17625.

Synchrotron FTIR micro-spectroscopy for structural analysis of Lewy bodies in the brain of Parkinson's disease patients

Affiliations

Synchrotron FTIR micro-spectroscopy for structural analysis of Lewy bodies in the brain of Parkinson's disease patients

Katsuya Araki et al. Sci Rep. .

Abstract

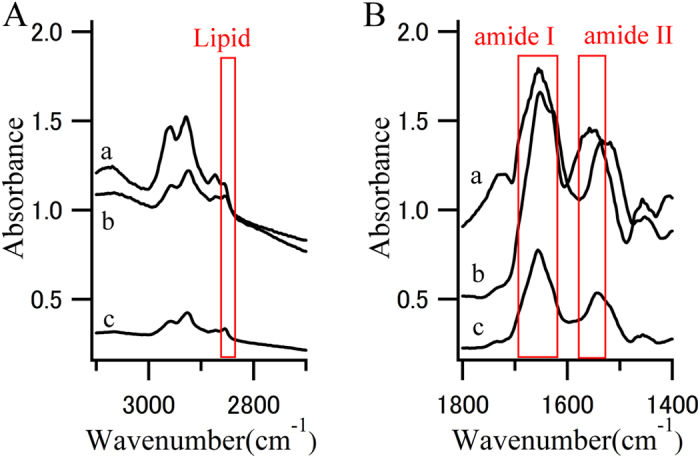
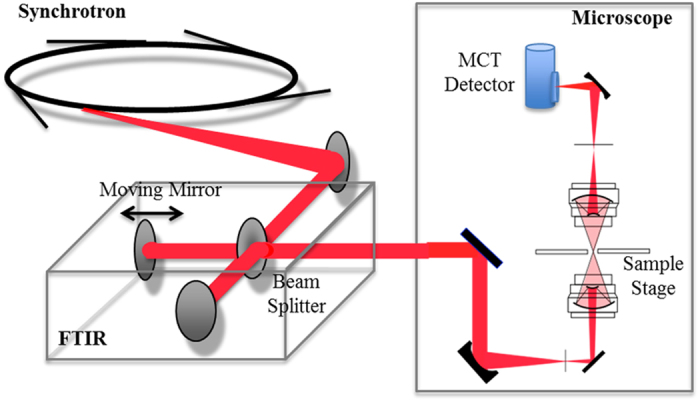
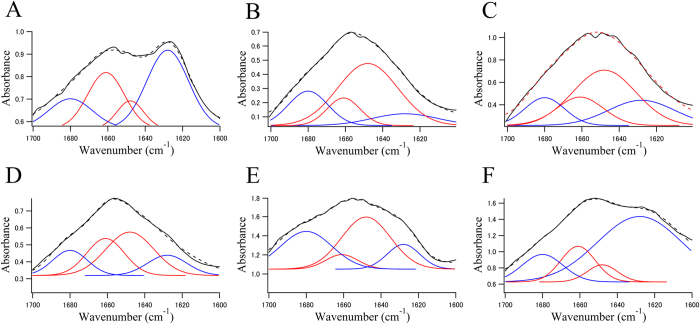
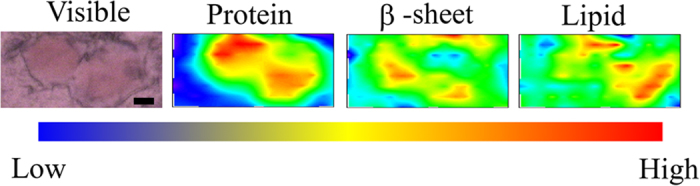
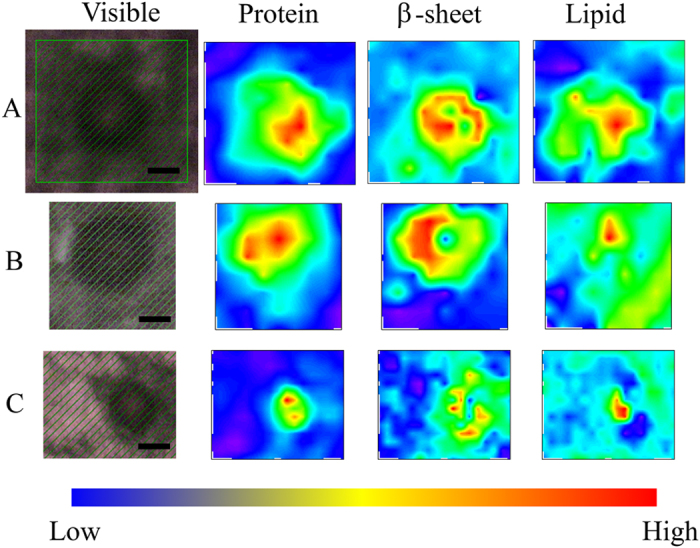
Lewy bodies (LBs), which mainly consist of α-synuclein (α-syn), are neuropathological hallmarks of patients with Parkinson's disease (PD). The fine structure of LBs is unknown, and LBs cannot be made artificially. Nevertheless, many studies have described fibrillisation using recombinant α-syn purified from E. coli. An extremely fundamental problem is whether the structure of LBs is the same as that of recombinant amyloid fibrils. Thus, we used synchrotron Fourier transform infrared micro-spectroscopy (FTIRM) to analyse the fine structure of LBs in the brain of PD patients. Our results showed a shift in the infrared spectrum that indicates abundance of a β-sheet-rich structure in LBs. Also, 2D infrared mapping of LBs revealed that the content of the β-sheet structure is higher in the halo than in the core, and the core contains a large amount of proteins and lipids.


Figures

Figure 1
Figure 1. FTIR spectra.
(A) CH stretch region and (B) amide I and II region from the (a) core of an LB, (b) halo of an LB, and (c) normal brain tissue. Red boxes represent characteristic absorption region for lipids or proteins.
Figure 2
Figure 2. Optical layout of the microspectroscopic station at BL43IR.
The infrared synchrotron light is injected into the FTIR (BRUKER VERTEX70) interferometer, and the light then goes to the microscope (BRUKER HYPERION2000). Infrared light transmitted through a sample is detected by an MCT (HgCdTe) detector.
Figure 3
Figure 3. The solid black line in each panel shows an FTIRM spectrum (amide I region) obtained from (A) fibrils of α-syn expressed in E. coli, (B) normal brain tissue from the patient with AD, (C) the core of an SP, (D) normal brain tissue from the brain of the patient with PD, (E) the core of an LB, and (F) the halo of an LB.
Blue and red lines represent contributions of β-sheet structures and non-β-sheet structures (random coils, α-helices, and others), respectively. The dotted line represents the fitted curve. Data were fitted using a Gaussian species model centred at 1628, 1680 (β-sheets, blue line), 1648, and 1661 (random coils, α-helices, and others, red line) cm−1 .
Figure 4
Figure 4. Typical visible and FTIR images of an SP in brain tissue derived from the patient who had AD pathology.
Shown from left to right are a microscope image, the amount of total proteins, the proportion of β-sheet structures, and the amount of lipids. The colour bar indicates low (blue) to high (red) contents. The area in the visible image was scanned with 5-μm steps (16 × 8 pixels = 80 × 40 μm2). Scale bar, 10 μm. Protein-rich regions correspond well to the regions stained with Congo red. The proportion of β-sheet structures is high in the core of the plaque. Lipids exist around the core of the plaque.
Figure 5
Figure 5. Visible and FTIR images of typical LBs in the substantia nigra of the midbrain derived from the 83-year-old female PD patient.
Different LBs and different scanning steps are shown. Shown from left to right are a microscope image, the amount of total proteins, the proportion of β-sheet structures, and the amount of lipids. The colour bar indicates low (blue) to high (red) contents. The area shaded with green was scanned with 3- to 5-μm steps. (A) 4-μm step, 12 × 11 pixels = 48 × 44 μm2. (B) 5-μm step, 8 × 9 pixels = 40 × 45 μm2. (C) 3-μm step, 14 × 17 pixels = 42 × 51 μm2. Scale bar, 10 μm.

References

    1. Spillantini M. G., Crowther R. A., Jakes R., Hasegawa M. & Goedert M. α-Synuclein in filamentous inclusions of Lewy bodies from Parkinson disease and dementia with Lewy bodies. Proc. Natl. Acad. Sci. 95, 6469–6473 (1998). - PMC - PubMed
    1. Baba M. et al. Aggregation of α-synuclein in Lewy bodies of sporadic Parkinson disease and dementia with Lewy bodies. Am. J. Pathol. 152, 879–884 (1998). - PMC - PubMed
    1. Maroteaux L., Campanelli J. T. & Scheller R. H. Synuclein – a neuron-specific protein localized to the nucleus and presynaptic nerve terminal. J. Neurosci. 8, 2804–2815 (1988). - PMC - PubMed
    1. Iwai A. et al. The precursor protein of non-A beta component of Alzheimer’s disease amyloid is a presynaptic protein of the central nervous system. Neuron 14, 467–475 (1995). - PubMed
    1. Bottner M. et al. Expression pattern and localization of alpha-synuclein in the human enteric nervous system. Neurobiol. Dis. 48, 474–480 (2012). - PubMed

Publication types