. 2015 Dec 15;112(50):15438-43.
doi: 10.1073/pnas.1510540112. Epub 2015 Nov 30.

Neofunction of ACVR1 in fibrodysplasia ossificans progressiva

Affiliations

Neofunction of ACVR1 in fibrodysplasia ossificans progressiva

Kyosuke Hino et al. Proc Natl Acad Sci U S A. .

Abstract

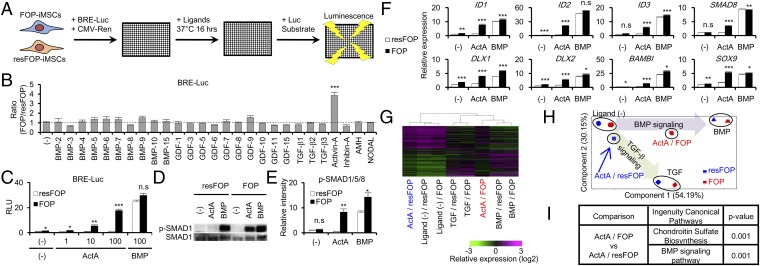
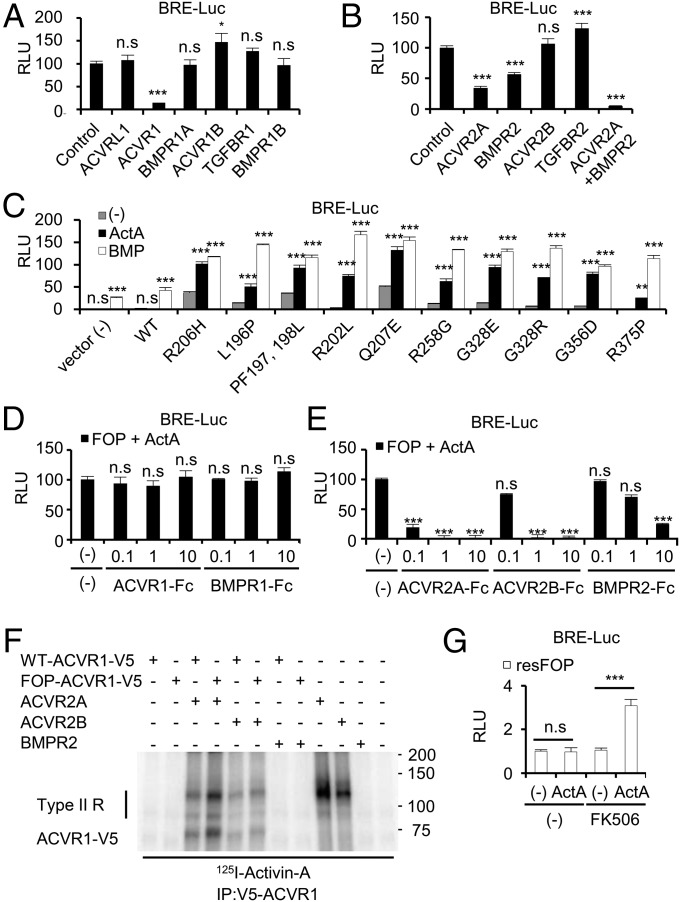
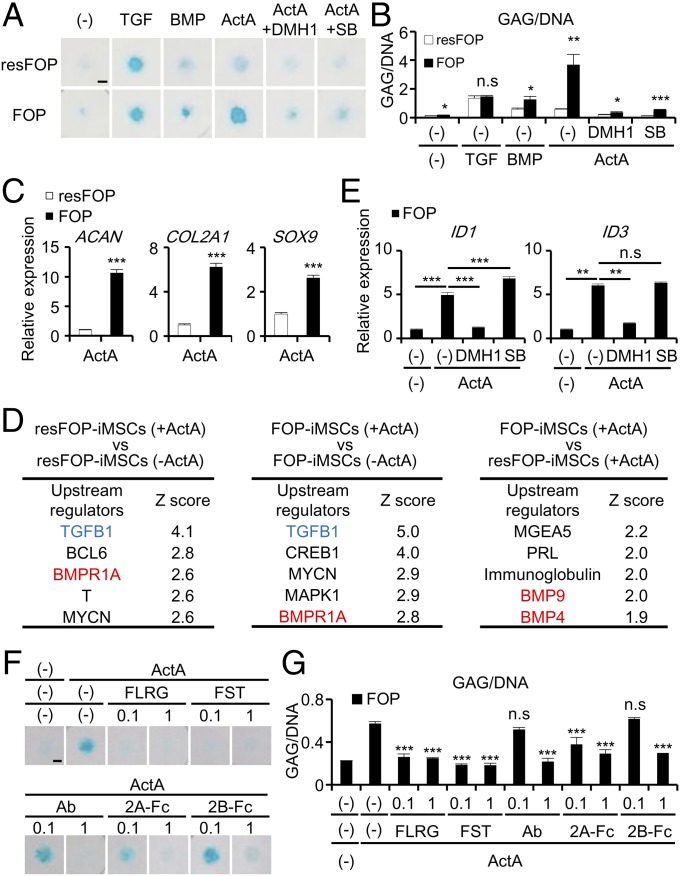
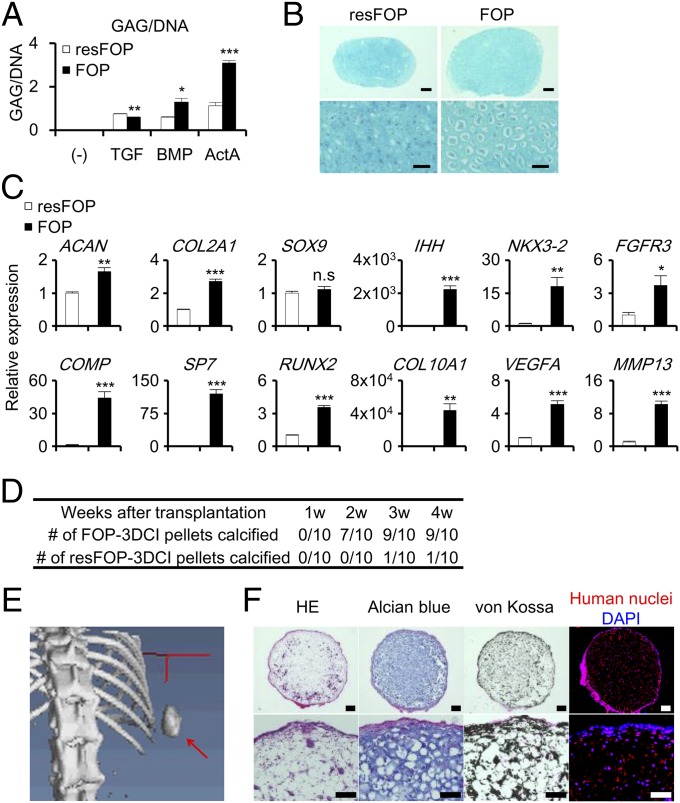
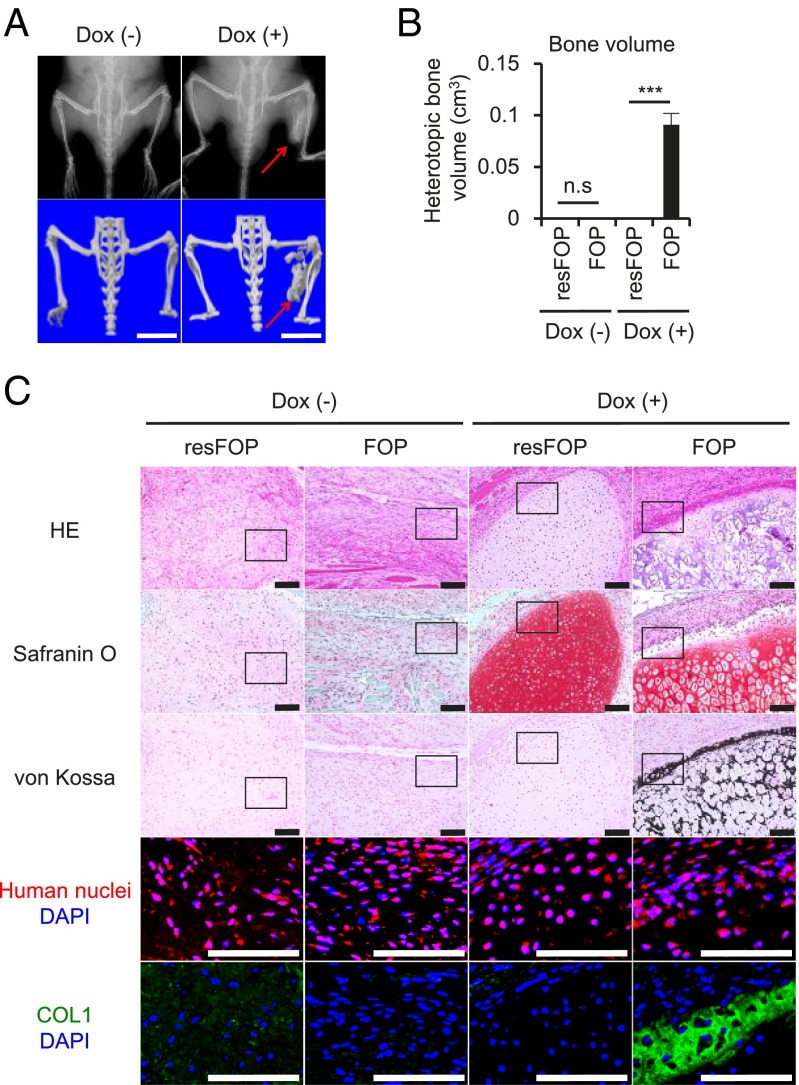
Fibrodysplasia ossificans progressiva (FOP) is a rare genetic disease characterized by extraskeletal bone formation through endochondral ossification. FOP patients harbor point mutations in ACVR1 (also known as ALK2), a type I receptor for bone morphogenetic protein (BMP). Two mechanisms of mutated ACVR1 (FOP-ACVR1) have been proposed: ligand-independent constitutive activity and ligand-dependent hyperactivity in BMP signaling. Here, by using FOP patient-derived induced pluripotent stem cells (FOP-iPSCs), we report a third mechanism, where FOP-ACVR1 abnormally transduces BMP signaling in response to Activin-A, a molecule that normally transduces TGF-β signaling but not BMP signaling. Activin-A enhanced the chondrogenesis of induced mesenchymal stromal cells derived from FOP-iPSCs (FOP-iMSCs) via aberrant activation of BMP signaling in addition to the normal activation of TGF-β signaling in vitro, and induced endochondral ossification of FOP-iMSCs in vivo. These results uncover a novel mechanism of extraskeletal bone formation in FOP and provide a potential new therapeutic strategy for FOP.

Keywords: BMP; TGF; fibrodysplasia ossificans progressiva; heterotopic ossification; iPSC.


Conflict of interest statement

Conflict of interest statement: K. Hino, K. Horigome, and H.E. are employees of Sumitomo Dainippon Pharma Co., Ltd; and M.I. and J.T. are supported by a research fund from Sumitomo Dainippon Pharma Co., Ltd.

Figures

Fig. 1.
Fig. 1.
Activin-A abnormally transduced BMP signaling in FOP-iMSCs. (A) Scheme of FOP-ACVR1 specific ligand screening. (B) Activin-A caused the highest increase in BRE-Luc activity (FOP/resFOP) among TGF-β superfamily ligands tested. (C) Activin-A increased BRE-Luc activity in FOP-iMSCs, but not in resFOP-iMSCs. (D) Representative image of Western blot analysis. Activin-A induced phosphorylation of SMAD1/5/8 (p-SMAD1) in FOP-iMSCs, but not in resFOP-iMSCs. After 6-h serum starvation, FOP- and resFOP-iMSCs were treated with ligands for 1 h. (E) Quantification of relative p-SMAD1/5/8 phosphorylation levels corrected by total SMAD1/5/8. (F) Higher expression levels of BMP target genes in FOP-iMSCs stimulated with Activin-A in microarray analysis. (G–I) Global gene expression analysis showed Activin-A transduced BMP signaling in FOP-iMSCs. Hierarchical clustering analysis (G) and a PCA plot (H) of FOP- and resFOP-iMSCs using differentially expressed gene sets. (I) Ingenuity pathway analysis using genes differentially expressed between FOP- and resFOP-iMSC treated with Activin-A. Results are the mean ± SE. n = 3–4 (BRE-Luc assay) and n = 3 (Western blot and microarray analysis). n.s., no significant difference; *P < 0.05; **P < 0.01; ***P < 0.001 by Dunnett’s multiple comparisons t test compared with the no ligand treatment control (B) and by Student’s t test compared with resFOP-iMSCs treated with the same ligands (C, E, and F). ActA, 100 ng/mL Activin-A; BMP, 100 ng/mL BMP-7; TGF, 10 ng/mL TGF-β3 (D–I).
Fig. 2.
Fig. 2.
Molecular mechanisms of abnormal BMP signaling evoked by Activin-A. (A and B) Activin-A transduced FOP-ACVR1-mediated BMP signaling through ACVR2A and BMPR2. FOP-iMSCs transiently transfected with BRE-Luc, CMV-Renilla, and siRNAs specific for type I receptors (A) or type II receptors (B) were stimulated with Activin-A for 16 h. Note, neither ACVR1C nor AMHR2 were expressed in FOP-iMSCs. (C) Other FOP mutant receptors also transduced BMP signaling by Activin-A stimulation. U2OS cells transiently transfected with BRE-Luc, CMV-Renilla, and FOP mutant receptors were stimulated with 20 ng/mL Activin-A or 10 ng/mL BMP-7 for 16 h. (D and E) Activin-A strongly bound to the extracellular region of ACVR2A, 2B and weakly to BMPR2, but not to ACVR1. (F) Binding of 125I-Activin-A to LentiX293T transfected with hACVR1-V5, SNAP-hACVR2A, SNAP-hACVR2B, or hBMPR2. Cells were affinity labeled with 125I-Activin-A and cross-linked by disuccinimidyl suberate. Type II R, Type II receptors. (G) resFOP-iMSCs acquired Activin-A responsiveness by FK506 treatment. resFOP-iMSCs transiently transfected with BRE-Luc and CMV-Renilla were treated with 1 μM FK506 or Activin-A for 16 h. n.s., no significant difference; *P < 0.05; **P < 0.01; ***P < 0.001 by Dunnett’s multiple comparisons t test compared with the control siRNA transfected-FOP-iMSCs (A and B), to the no ligand treatment controls transfected with the same receptors (C), or to the no Fc-fusion receptors treatment control (D and E), and by Student’s t test (G). Results are the mean ± SE. n = 4–8.
Fig. 3.
Fig. 3.
Enhanced chondrogenesis of 2D chondrogenic micromass of FOP-iMSCs by Activin-A stimulation, which was suppressed by Activin-A inhibitors. (A–G) Two-dimensional chondrogenic micromass assay of FOP- and resFOP-iMSCs at day 7. (A) Representative images of Alcian blue staining. (Scale bar, 200 μm.) (B) Enhanced GAG/DNA in the micromass of FOP-iMSCs cultured with Activin-A, and which was inhibited by 1 μM DMH1 or 1 μM SB431542 (SB) treatment. TGF, 1 ng/mL TGF-β3. (C) Higher expression levels of early chondrogenic markers (ACAN, COL2A1, and SOX9) in the micromass of FOP-iMSCs cultured with Activin-A. (D) Upstream analysis using genes up- or down-regulated at least twofold after chondrogenic differentiation with or without Activin-A. (E) DMH1 (1 μM), but not SB (1 μM) inhibit the expression of BMP downstream target genes 16 h after stimulation by Activin-A. (F and G) Activin-A-triggered enhanced chondrogenesis of FOP-iMSCs was inhibited by several Activin-A inhibitors. Results are the mean ± SE. n = 4 (B, C, G), n = 3 (E), and n = 1 (D). n.s., no significant difference; *P < 0.05; **P < 0.01; ***P < 0.001 by Student’s t test compared with resFOP treated with the same ligands with or without the same compounds (B and C) and by Dunnett’s multiple comparisons t test compared with Activin-A-treated FOP-iMSCs (E) or Activin-A-treated micromass without Activin-A inhibitors (G).
Fig. 4.
Fig. 4.
Enhanced chondrogenesis of 3DCI pellets of FOP-iMSCs by Activin-A stimulation, which spontaneously calcified in vivo. (A) GAG/DNA of 3DCI pellet from FOP- and resFOP-iMSCs cultured with Activin-A (ActA), BMP-7 (BMP), or TGF-β3 (TGF) at day 17. (B and C) 3DCI pellet assay from FOP- and resFOP-iMSCs cultured with Activin-A at day 21. (B) Alcian blue staining of FOP- and resFOP-3DCI pellets. [Scale bars, 200 μm (Upper); 50 μm (Lower).] (C) Higher expression levels of late chondrogenic markers were seen in the FOP-3DCI pellets. (D–F) FOP-3DCI pellets spontaneously calcified in vivo. FOP- or resFOP-3DCI pellets cultured for 21 d with Activin-A were subcutaneously transplanted in NOD/ShiJic-scid Jcl (NOD/SCID) mice. Ten mice were transplanted with both FOP-3DCI (right side) and resFOP-3DCI pellets (left side) for 28 d. (D) Number of FOP- or resFOP-3DCI pellets calcified in vivo assessed by X-ray imaging. (E) A μCT image shows a calcified FOP-3DCI pellet (red arrow). (F) Histological analysis of transplanted FOP-3DCI pellets. H&E, Alcian blue staining (sulfated polysaccharides), von Kossa staining (calcium), and anti-human nuclei staining are shown. [Scale bars, 200 μm (Upper); 100 μm (Lower).] Results are the mean ± SE. n = 3 (A and C). n.s., no significant difference; *P < 0.05; **P < 0.01; ***P < 0.001 by Student’s t test compared with resFOP treated with the same ligands (A and C).
Fig. 5.
Fig. 5.
Transplanted FOP-iMSCs were ossified in vivo by Activin-A stimulation. (A–C) FOP- (right leg) and resFOP-iMSCs (left leg) were transplanted into the gastrocnemius muscle of NOD/SCID mice with Dox-inducible Activin-A expressing C3H10T1/2. Transplanted cells were analyzed 6 wk after transplantation. (A) X-ray and μCT images. Red arrows show FOP-iMSCs derived bone. (Scale bars, 10 mm.) (B) Heterotopic bone volume (cm3) of each group. Results are the mean ± SE. n = 3. n.s., no significant difference; ***P < 0.001 by Student’s t test compared with resFOP transplanted tissue. (C) Histological analysis of FOP- and resFOP-iMSCs derived tissue. HE, Safranin O, von Kossa, anti-human nuclei staining, and anti-COL1 staining are shown. (Scale bars, 100 μm.)

References

    1. Kaplan F, et al. The phenotype of fibrodysplasia ossificans progressiva. Clin Rev Bone Miner Metab. 2005;3(3-4):183–188.
    1. Shore E, Feldman G, Xu M, Kaplan F. The genetics of fibrodysplasia ossificans progressiva. Clin Rev Bone Miner Metab. 2005;3(3-4):201–204.
    1. Kaplan FS, Groppe J, Pignolo RJ, Shore EM. Morphogen receptor genes and metamorphogenes: Skeleton keys to metamorphosis. Ann N Y Acad Sci. 2007;1116:113–133. - PubMed
    1. Kaplan FS, et al. Fibrodysplasia ossificans progressiva. Best Pract Res Clin Rheumatol. 2008;22(1):191–205. - PMC - PubMed
    1. Shore EM, Kaplan FS. Inherited human diseases of heterotopic bone formation. Nat Rev Rheumatol. 2010;6(9):518–527. - PMC - PubMed

Publication types

MeSH terms

Associated data