. 2015 Dec 15;112(50):15444-9.
doi: 10.1073/pnas.1506943112. Epub 2015 Nov 30.

Reversion to an embryonic alternative splicing program enhances leukemia stem cell self-renewal

Affiliations

Reversion to an embryonic alternative splicing program enhances leukemia stem cell self-renewal

Frida Holm et al. Proc Natl Acad Sci U S A. .

Abstract

Formative research suggests that a human embryonic stem cell-specific alternative splicing gene regulatory network, which is repressed by Muscleblind-like (MBNL) RNA binding proteins, is involved in cell reprogramming. In this study, RNA sequencing, splice isoform-specific quantitative RT-PCR, lentiviral transduction, and in vivo humanized mouse model studies demonstrated that malignant reprogramming of progenitors into self-renewing blast crisis chronic myeloid leukemia stem cells (BC LSCs) was partially driven by decreased MBNL3. Lentiviral knockdown of MBNL3 resulted in reversion to an embryonic alternative splice isoform program typified by overexpression of CD44 transcript variant 3, containing variant exons 8-10, and BC LSC proliferation. Although isoform-specific lentiviral CD44v3 overexpression enhanced chronic phase chronic myeloid leukemia (CML) progenitor replating capacity, lentiviral shRNA knockdown abrogated these effects. Combined treatment with a humanized pan-CD44 monoclonal antibody and a breakpoint cluster region - ABL proto-oncogene 1, nonreceptor tyrosine kinase (BCR-ABL1) antagonist inhibited LSC maintenance in a niche-dependent manner. In summary, MBNL3 down-regulation-related reversion to an embryonic alternative splicing program, typified by CD44v3 overexpression, represents a previously unidentified mechanism governing malignant progenitor reprogramming in malignant microenvironments and provides a pivotal opportunity for selective BC LSC detection and therapeutic elimination.

Keywords: CD44v3; MBNL3; RNA splicing; adhesion molecules; self-renewal.


Conflict of interest statement

The authors declare no conflict of interest.

Figures
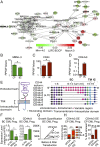
Fig. 1.
Fig. 1.
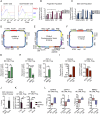
Reversion to an embryonic splicing program contributes to malignant reprogramming. (A) Cytoscape network of previously published MBNL and ESC-specific alternative splicing program-related transcripts (6). Nodes are colored according to log twofold change of fragments of kilobase of exon per million fragments mapped (FPKM) in BC over FPKM in CP. Solid lines represent gene interactions derived from the Reactome Functional Interaction (FI) annotations. Dashed lines represent predicted interactions from the Reactome FI annotations. (B) RNAseq analysis of MBNL3 expression in BC CML progenitor cells compared with progenitors from CP CML patient samples (P = 0.038; n = 8). (C) RNAseq analysis of CD44 expression in BC CML progenitor cells compared with progenitors from CP CML patient samples (P = 0.013; n = 8). (D) RNAseq analysis of CD44v3 expression in BC CML progenitor cells compared with CP CML progenitors. (E) Model of CD44 exon organization. Colors of circles represent receptor placement or function as follows: black, the ectodomain; dark blue, intracellular (IC) domain; green, the HA binding domain; light blue, transmembrane (TM) domain; pink, variable exons (10, 21). (F) qRT-PCR analysis of MBNL3 (P = 0.049, Left) and CD44v3 (P = 0.037, Right) expression after MBNL3 KO in BC CML progenitors compared with pLKO (n = 3). (G) Growth quantification of BC CML progenitors transduced with lentiviral shRNA for CD44v3 shows that knock-down of CD44v3 impacts the cell growth compared with untransduced and sh-control (n = 3). (H) Lentiviral overexpressing (OE) of CD44v3 in CP CML progenitor increased hematopoietic colony formation (Left) (P = 0.003), specifically of G (P = 0.028), M (P = 0.008), mixed (P = 0.009), and Bfu-E (P = 0.008) colonies. CD44v3 OE CP patient samples showed a trend of increased self-renewal capacity (P = 0.081) as measured by secondary colony formation (Right) (n = 3).
Fig. S1.
Fig. S1.
CD44 variant expression in BC CML cells. CD44v3 knockdown reduces proliferation of BC CML cells. (A) Representative image of median fluorescence intensity for CD44 shows higher levels of CD44 in BC CML compared with CP CML. (B) qRT-PCR validation of RNASeq CD44 splice variant results using isoform-specific primers. CD44v1 and CD44v5 were expressed at equal levels in progenitor cells (LinCD34+CD38+) isolated from healthy blood donor (NPB) (n = 3), CP (n = 5), and BC (n = 6) patients. CD44v3 was significantly higher expressed in hESCs compared with progenitor cells (P = 0.0114) isolated from NPB. Progenitor cells isolated from CP patients had a significantly lower expression of CD44v3 compared with hESCs (P = 0.0107). Progenitor cells from BC patients had significantly higher expression of CD44v3 compared with CP patients (P = 0.0354). (C) qRT-PCR validation of RNASeq CD44 splice variant results using isoform-specific primers. CD44v1 and CD44v5 were expressed at equal levels in the stem cells (LinCD34+CD38) isolated from NPB (n = 4), CP CML (CP) (n = 5), and BC CML (BC) (n = 4). CD44v3 was higher in hESCs compared with both stem cells (P = 0.012) isolated from NPB. (D) Schematic figure of shMBNL3 knockdown vector. (E) Schematic figure of CD44v3 overexpression vector. (F) Schematic figure of shCD44v3 knockdown vector. (G) Knockdown of MBNL3 in BC CML progenitor cells resulted in significantly (P = 0.0462) increased CD44v1 levels. However, levels were lower than corresponding CD44v3 levels (Fig. 1G; P = 0.0372; n = 3). (H) Knockdown of MBNL3 (P = 0.0500) in CP CML progenitor cells (Left) resulted in significantly (P = 0.0496) increased OCT4 levels (Right) (n = 3). (I) Expression of CD44v3 (Left) and MBNL3 (P = 0.0048) (Right) in CP CML patient samples after lentiviral CD44v3 overexpression (n = 3). (J) CD44v3 overexpressed CP CML patient samples have an enrichment of OCT4 on the CD44 promoter. Using ChIP-qPCR, enrichment is presented as % input and normalized to pCDH backbone (n = 3). (K) There is a significantly higher expression of the prosurvival longer isoform of MCL-1 (Left) for both pCDH (P = 0.0073) and CD44v3 overexpressed CP CML samples (P = 0.0176; n = 5). There is a significantly higher expression of the prosurvival longer isoform of BCLX (Right) for both pCDH (P = 0.016) and CD44v3 overexpressed CP CML samples (P = 0.0010; n = 5). (L) In recue experiments, BC CML LSCs were knocked down with CD44v3 for 24 h. After knockdown of CD44v3, BC CML LSCs were overexpressed with CD44v3 for 24 h. Rescue was detected for CD44v3 (Δ% = 134; to a higher extent than full-length CD44, CD44v1 Δ% = 38), SOX2 (Δ% = 43), and MBNL3 (Δ% = 81). Results are presented as Δ% between knockdown and overexpression to validate level of rescue.
Fig. 2.
Fig. 2.
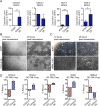
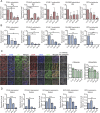
CD44v3 promotes pluripotent stem cell maintenance. (A) CD44v3 expression in undifferentiated hESCs (n = 6; P = 0.006) compared with their differentiated counterparts, embryoid bodies (n = 3). (B) MBNL3 expression in undifferentiated hESCs compared with embryoid bodies (n = 3). (C) OCT4 enrichment on CD44 promoter in CD44v3 OE hESCs (n = 3). (D) Active histone mark H4K16Ac analysis enriched on the CD44 promoter in CD44v3 OE hESCs (n = 3). (E) Prosurvival MCL1 long isoform expression in hESCs following lentiviral CD44v3 OE compared with pCDH backbone-transduced controls (P = 0.0415). Shown are the difference between long and short isoform in CD44v3 OE samples (P = 0.0262; n = 3) and BCLX long isoform expression in hESCs following CD44v3 compared with pCDH expression (P = 0.040). Shown is the difference between long and short isoforms in CD44v3 OE samples (P = 0.011; n = 3). (F) Immunostained hESCs after lentiviral OE of CD44v3. Cells express FLAG (CD44v3) and OCT4. The cell nucleus is stained with DAPI. (G) Confocal fluorescence microscopic analysis of β-catenin expression in hESCs after lentiviral OE of FLAG-tagged CD44v3 compared with pCDH. (H) OCT4 enrichment on the β-catenin promoter in hESCs OE CD44v3 (P = 0.0343) compared with pCDH backbone (n = 3). (I) CD44v3 OE and CD44v3 KO effects of cell proliferation compared with untransduced and backbone-transduced controls (n = 3). (J) qRT-PCR analysis of pluripotency transcripts, including OCT4 (P = 0.0133), SOX2 (P = 0.0034), and MBNL3 (P = 0.0583) of CD44v3 KO hESCs, compared with pCDH and CD44v1 KO (n = 3).
Fig. S2.
Fig. S2.
CD44v3 overexpression in hESCs impacts apoptosis and survival. (A) Shown are the CD44v3 levels in hESCs after lentiviral overexpression of CD44v3 (P = 0.013, Far Left). No change in CD44v1 (Middle Left) was detected (n = 5). Also shown are OCT4 levels in hESCs after lentiviral overexpression of CD44v3 (P = 0.002; n = 5) (Middle Right). CD44v3 overexpression causes elevated expression of pluripotency marker SOX2 (P = 0.013) in hESCs (n = 5) (Far Right). (B) Overexpression of CD44v3 in hESCs stabilizes the cell morphology throughout culture, with less differentiation and faster cell expansion as a result. (C) Knockdown of MBNL3 leads to less growth and colony formation and more differentiation, compared with hESCs transduced with pLKO backbone. (D) In recue experiments, hESCs were knocked down with CD44v3 for 24 h. After knockdown, hESCs were overexpressed with CD44v3 for 24 h. Rescue was detected for CD44v3 (Δ% = 168, Far Left; to a higher extent than full-length CD44, CD44v1 Δ% = 11, Middle Left), OCT4 (Δ% = 37, Middle), SOX2 (Δ% = 76, Middle Right), and MBNL3 (Δ% = 81, Far Right). Results are presented as Δ% between knockdown and overexpression to validate level of rescue.
Fig. 3.
Fig. 3.
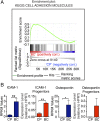
BC LSCs have a unique adhesion molecule gene expression pattern. (A) GSEA of cell adhesion molecule expression in BC compared with CP progenitors. (B) OPN expression in BC progenitors compared with CP as analyzed by RNAseq (Middle Right) and qPCR (n = 3; Far Right). ICAM-1 expression is increased in BC CML progenitors compared with CP CML progenitors as analyzed by RNAseq (Far Left) and qPCR (n = 3; Middle Left).
Fig. S3.
Fig. S3.
CD44v3 overexpression in hESCs and BC CML impacts OPN and ICAM-1 expression. (A) RNASeq gene analysis. Gene expression heat map of 76 cell adhesion-related genes in CP (n = 6) and BC (n = 6) progenitors (LinCD34+CD38+) isolated from patients before tyrosine kinase inhibitor therapy. Rows show relative gene expression (RPKM values) in log2 scale. (B) Cell adhesion-related genes differentially expressed between BC and CP progenitors. Eight genes were up-regulated and five genes were down-regulated in BC compared with CP (fold change ≥2 or ≤–2; FDR ≤ 0.5; P ≤ 0.05). Higher expression of HA interacting genes CD44, VCAN, ICAM-1, and SPP1 (OPN) was observed in BC compared with CP progenitor samples. (C) Table of cell adhesion molecules differentially expressed between BC and CP progenitors. (D) RHAMM expression is higher in progenitors isolated from CP CML (CP) or BC CML (BC) compared with healthy donor peripheral blood (NPB) as analyzed by RNAseq (n = 8; Left) and qPCR (n = 3; Right). (E) Expression levels of CD44v3 correlate with OPN (R2 = 0.806) and ICAM-1 (R2 = 0.841) in hESCs after lentiviral overexpression of CD44v3. (F) Lentiviral CD44v3 overexpression in CP progenitors (LinCD34+CD38+) correlated with higher expression of OPN (R2 = 0.731) and ICAM-1 (R2 = 0.714) but not with RHAMM (R2 = 0.094).
Fig. S4.
Fig. S4.
Robust human BC CML engraftment in hematopoietic mouse tissues. (A) Graphical summary of results and hypothesized effector function of CD44 mAb therapy. (B) Representative FACS plots showing human BC CML (BC) engraftment in peripheral blood (PB), BM, spleen, and myeloid sarcoma 8–10 wk posttransplant compared with no transplant control (No Tp Ctrl). Mice were transplanted with CD34+ BC11, BC12, or BC19 patient cells. Human cells were gated as live human CD45+. (C) Representative FACS plots showing BC CML (BC) progenitor cells (LinCD45+CD34+CD38+) in BM from mice transplanted with BC patient BC11, BC12, and BC19. Prog, LinCD45+CD34+CD38+ progenitor cells; Stem, LinCD45+CD34+CD38 stem cells. (D) Pooled data from six separate experiments using three different BC CML patient samples (BC11, BC12, BC19) showing human engraftment level (live CD45+ cells) in peripheral blood (PB), BM, spleen, and myeloid sarcomas from control mAb-treated mice. Graphs show mean ± SEM.
Fig. 4.
Fig. 4.
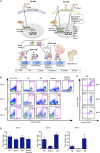
Disruption of BC LSC ligand interactions with CD44 and BCR-ABL inhibition. (A) Human BC CML LSC engraftment in peripheral blood, spleen, and BM from mice transplanted with patient BC11 (magenta; n ≥ 5 per treatment group), BC12 (blue; n ≥ 5 per treatment group), and BC19 (green; n ≥ 4 per treatment group). Combination therapy significantly reduced BC LSCs in the hematopoietic tissues of all three patient models. Graphs depict mean frequency BC LSCs (Live, Lin, CD45+CD34+CD38+) out of live cells ± SEM and values for individual mice. Pooled data are from five separate experiments. (B) Confocal fluorescence microscopic analysis of femur sections stained for CD34, CD38, and CD44. Mice treated with CD44 mAb alone or in combination with dasatinib showed a decrease in CD38 and CD44-positive cells. (C) Confocal fluorescence microscopic analysis revealed colocalization of CD34, CD38, and CD44 expression in the control group (C + V) and dasatinib-treated group (C + D). Dashed line, colocalization cutoff value of 0.5. (D) Frequency of human BC CML cells (LinCD45+) in peripheral blood, spleen, and BM from secondary recipient mice transplanted with human CD34+ BM cells from primary patient BC11 engrafted mice after treatment (n ≥ 4 per treatment group). Graphs show mean ± SEM and values for individual mice. (E) qRT-PCR gene expression of CD44, CD44v3, β-catenin, BCR-ABL1, and OPN in human CD34+ BC CML cells isolated from the BM of secondary recipient mice. Graphs show transcript levels normalized to control group.
Fig. S5.
Fig. S5.
Targeted CD44 and BCR-ABL1 inhibition reduces human BC LSC survival in hematopoietic tissues. (A) Human BC CML LSC cell engraftment in mice transplanted with patient BC12 (n ≥ 5 per treatment group). (B) Human BC CML LSC engraftment in mice transplanted with patient BC19 (n ≥ 4 per treatment group). (C) Human BC CML LSC engraftment in mice transplanted with patient BC11 (n ≥ 5 per treatment group). (D) Myeloid sarcoma formation in primary (Left) and secondary (Right) recipient mice transplanted with patient BC11 (n ≥ 5 per treatment group). (E) No mice within any of the four treatment groups showed any dramatic increase or decrease in body weight during the treatment period (Left). All four treatment groups show variability in the activity level throughout the treatment (Middle). However, none of the mice showed signs of low activity or being hunched down, a sign of low overall health. Mice in the control groups treated with control IgG + vehicle or control IgG + dasatanib both showed decreased signs of grooming during the course of treatment (Right). Mice treated with CD44 mAb and vehicle, however, had constant good grooming throughout the treatment. Treatment groups, control IgG + vehicle (C + V), control IgG + dasatinib (C + D), CD44 mAb + vehicle (44 + V), and CD44 mAb + dasatinib (44 + D). Graphs (A–D) depict mean frequency human BC CML LSCs (Live, Lin, CD45+CD34+CD38+) out of live cells ± SEM. Myeloid sarcoma graphs show number of tumors per mouse. Treatment groups, control IgG + vehicle (C + V), control IgG + dasatinib (C + D), CD44 mAb + vehicle (44 + V), and CD44 mAb + dasatinib (44 + D).
Fig. S6.
Fig. S6.
Targeted CD44 and BCR-ABL1 inhibition reduces human BC LSC survival in hematopoietic tissues. (A and B) Representative dot plots of human BC CML cell (Live, LinCD45+) and progenitor cell (Live, LinCD45+CD34+CD38+) engraftment in BM from BC11, BC12, and BC19 transplanted mice after 14 d of therapy with control IgG + vehicle (C + V), control IgG + dasatinib (C + D), CD44 mAb + vehicle (44 + V), and CD44 mAb + dasatinib (44 + D). (C) In vitro cytotoxicity assay shows no direct cytotoxic effect of CD44 mAb compared with control IgG in CD34+ cells from cord blood (Left), CP CML (Middle), or BC CML (Right). (D) In vitro treatment with CD44 mAb shows no change in differentiation compared with control IgG in CD34+ cells from cord blood (Left), CP CML (Middle), or BC CML (Right).
Fig. S7.
Fig. S7.
CD44 and BCR-ABL1 inhibition reduces human adhesion molecule expression in BM and spleen of BC LSC transplanted mice. (A) qRT-PCR of gene expression of CD44, CD44v3, ICAM-1, RHAMM, and OPN normalized to the control group in BM from patient BC11-transplanted mice treated with control IgG (C + V), dasatinib (C + D), CD44 mAb (44 + V), or a combination of CD44 mAb and dasatinib (44 + D). (B) qRT-PCR gene expression of CD44, CD44v3, ICAM, RHAMM, and OPN normalized to the control group in spleen from patient BC11-transplanted mice treated with dasatinib, CD44 mAb, or a combination of CD44 mAb and dasatinib. (C) Femur sections stained for CD34, CD38, and HA and CD34, CD38, and OPN. Mice treated with CD44 mAb alone or in combination with dasatinib showed a decrease in CD38, CD44, OPN, and HA-positive cells. Image colocalization analysis revealed colocalization of CD34+ cells with CD38, HA, and OPN in the control group (C + V) and dasatinib-treated group (C + D). Femurs from mice treated with CD44 mAb single agent (44 + V) showed a loss of colocalization between CD34+ cells and CD38 and HA but not OPN. Femurs from mice receiving combination therapy (44 + D) showed a loss of colocalization between CD34+ cells with CD38, HA, and OPN. The dashed line indicates the colocalization cutoff value of 0.5. (D) qRT-PCR gene expression of CD44, CD44v3, β-catenin, BCR-ABL, and OPN in human CD34+ BC CML cells isolated from the spleen of secondary recipient mice. Graphs show transcript levels normalized to the control group. Treatment groups, control IgG + vehicle (C + V), control IgG + dasatinib (C + D), CD44 mAb + vehicle (44 + V), and CD44 mAb + dasatinib (44 + D). Image analysis of colocalization was performed using Pearson’s correlation. Pearson’s correlation coefficient values ranging from 0.5–1 indicate colocalization. Values ranging from –1 to 0.5 indicate absence of colocalization.

References

    1. Takahashi K, Yamanaka S. Induction of pluripotent stem cells from mouse embryonic and adult fibroblast cultures by defined factors. Cell. 2006;126(4):663–676. - PubMed
    1. Yu J, et al. Induced pluripotent stem cell lines derived from human somatic cells. Science. 2007;318(5858):1917–1920. - PubMed
    1. Chen LL, Carmichael GG. Altered nuclear retention of mRNAs containing inverted repeats in human embryonic stem cells: Functional role of a nuclear noncoding RNA. Mol Cell. 2009;35(4):467–478. - PMC - PubMed
    1. Cheng Y, et al. Mouse ENCODE Consortium Principles of regulatory information conservation between mouse and human. Nature. 2014;515(7527):371–375. - PMC - PubMed
    1. Van Hoof D, et al. Phosphorylation dynamics during early differentiation of human embryonic stem cells. Cell Stem Cell. 2009;5(2):214–226. - PubMed

Publication types

MeSH terms