. 2016 Feb;57(2):233-45.
doi: 10.1194/jlr.M063412. Epub 2015 Nov 30.

Hepatocytes release ceramide-enriched pro-inflammatory extracellular vesicles in an IRE1α-dependent manner

Affiliations

Hepatocytes release ceramide-enriched pro-inflammatory extracellular vesicles in an IRE1α-dependent manner

Eiji Kakazu et al. J Lipid Res. 2016 Feb.

Abstract

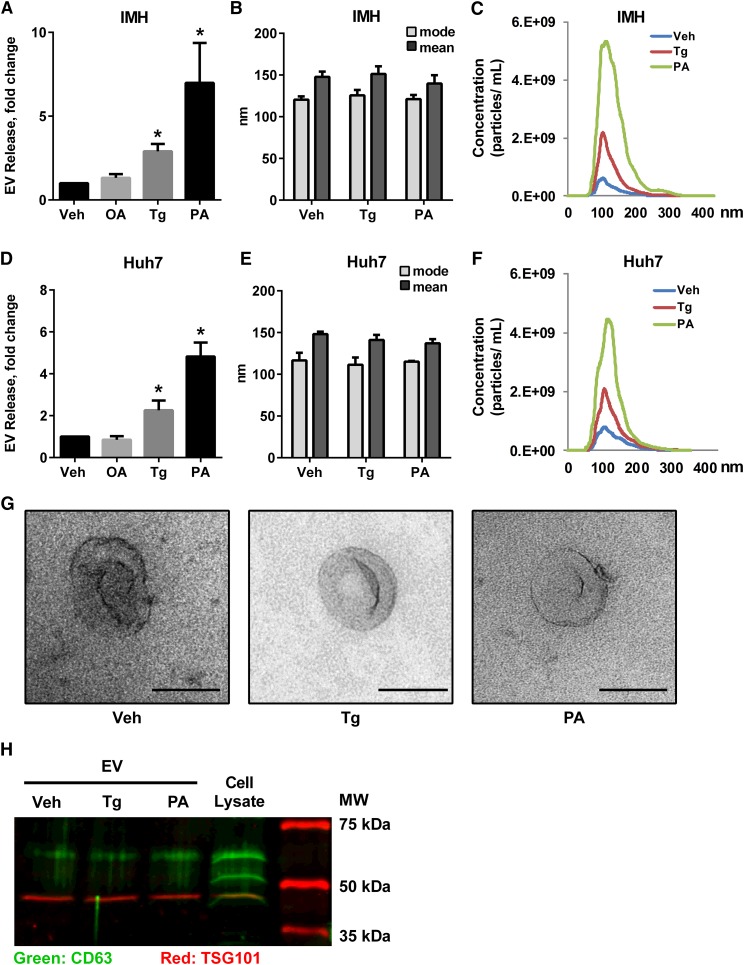
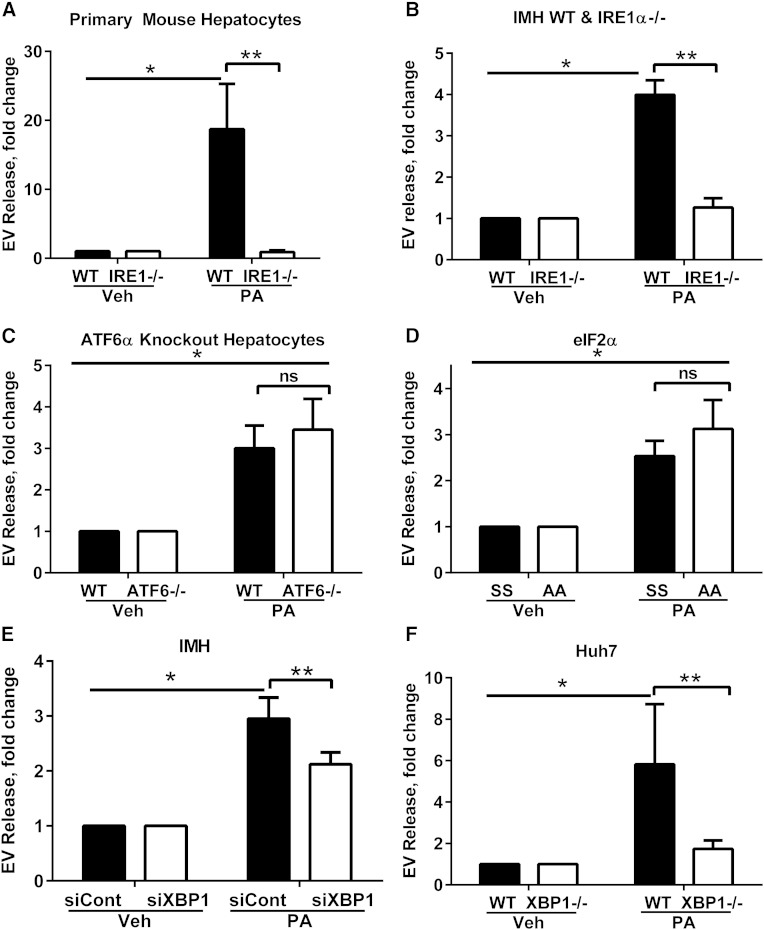
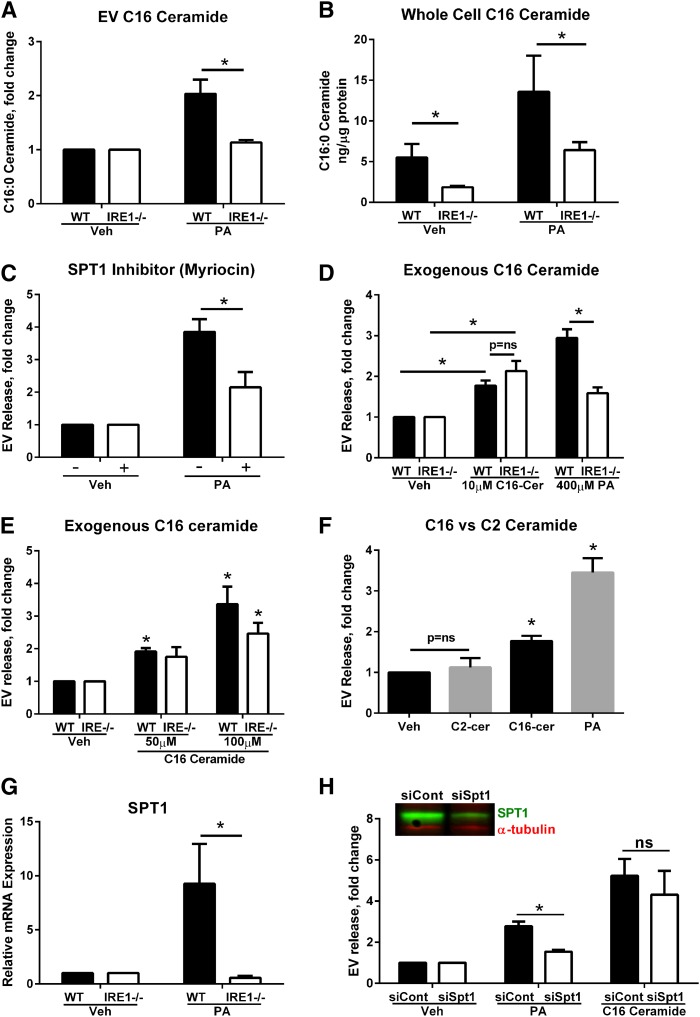
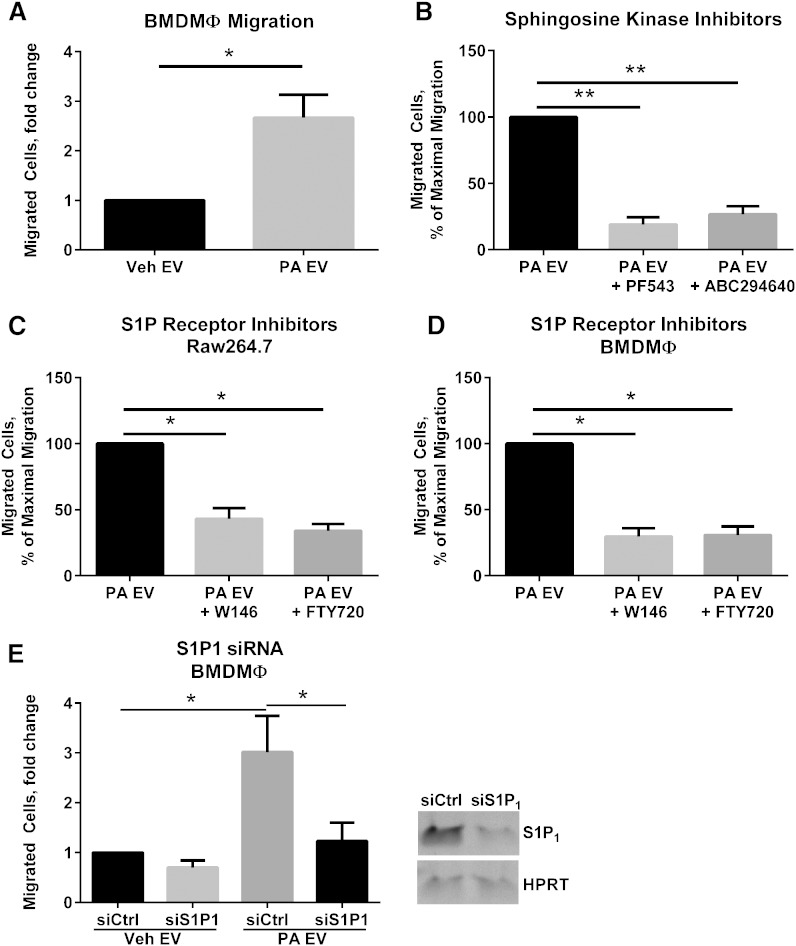
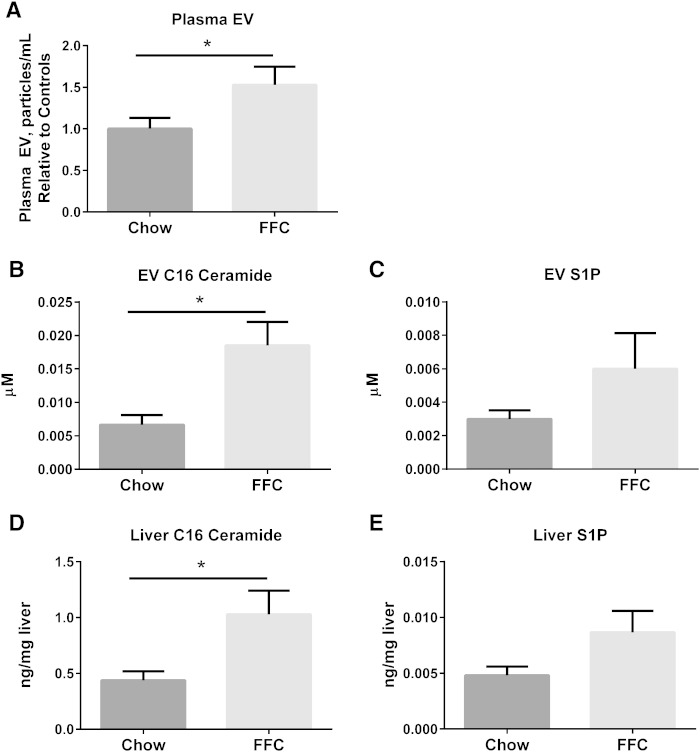
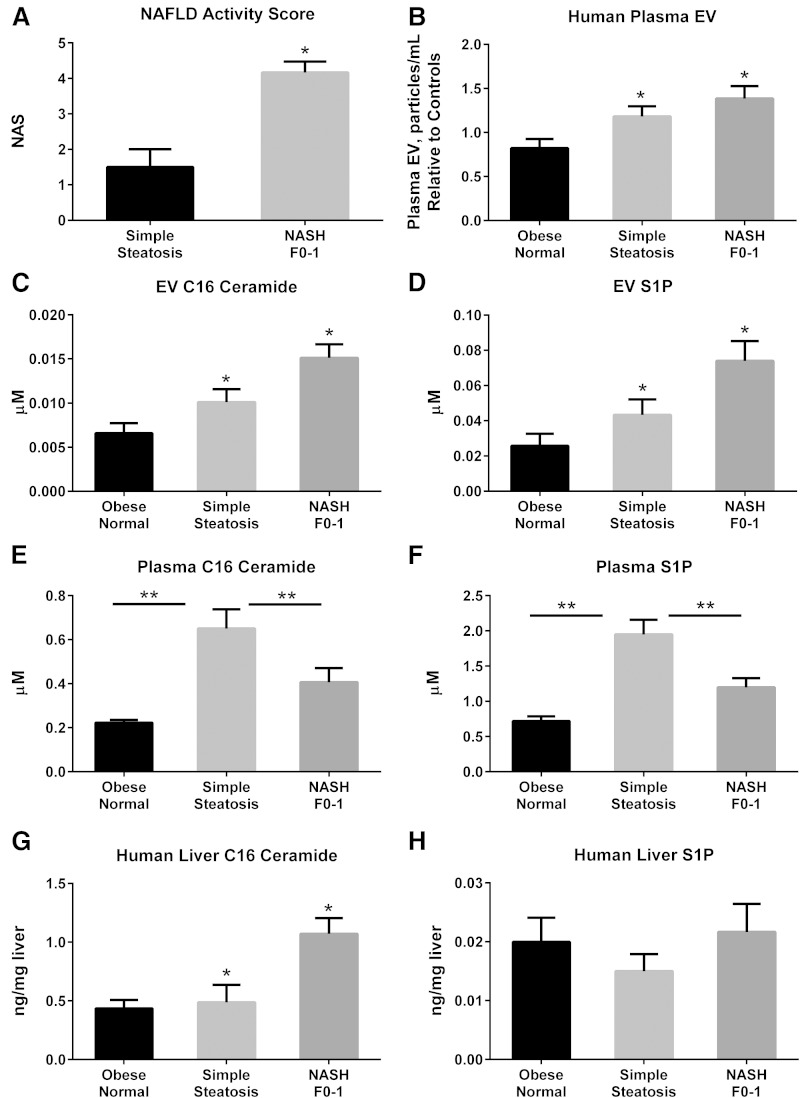
Nonalcoholic steatohepatitis (NASH) is a lipotoxic disease wherein activation of endoplasmic reticulum (ER) stress response and macrophage-mediated hepatic inflammation are key pathogenic features. However, the lipid mediators linking these two observations remain elusive. We postulated that ER stress-regulated release of pro-inflammatory extracellular vesicles (EVs) from lipotoxic hepatocytes may be this link. EVs were isolated from cell culture supernatants of hepatocytes treated with palmitate (PA) to induce lipotoxic ER stress, characterized by immunofluorescence, Western blotting, electron microscopy, and nanoparticle tracking analysis. Sphingolipids were measured by tandem mass spectrometry. EVs were employed in macrophage chemotaxis assays. PA induced significant EV release. Because PA activates ER stress, we used KO hepatocytes to demonstrate that PA-induced EV release was mediated by inositol requiring enzyme 1α (IRE1α)/X-box binding protein-1. PA-induced EVs were enriched in C16:0 ceramide in an IRE1α-dependent manner, and activated macrophage chemotaxis via formation of sphingosine-1-phosphate (S1P) from C16:0 ceramide. This chemotaxis was blocked by sphingosine kinase inhibitors and S1P receptor inhibitors. Lastly, elevated circulating EVs in experimental and human NASH demonstrated increased C16:0 ceramide. PA induces C16:0 ceramide-enriched EV release in an IRE1α-dependent manner. The ceramide metabolite, S1P, activates macrophage chemotaxis, a potential mechanism for the recruitment of macrophages to the liver under lipotoxic conditions.

Keywords: endoplasmic reticulum stress; exosome; inositol requiring enzyme 1α; lipoinflammation; microvesicle; nonalcoholic steatohepatitis.


Figures

Fig. 1.
Fig. 1.
PA induces EV release from hepatocytes. IMHs or human hepatoma cells (Huh7) were treated with 2.5 nM Tg, 400 μM OA, 400 μM PA, or vehicle (Veh) for 16 h. Fold increase in EV release (A, D), size distribution (B, E), and concentration and size distribution (C, F) are depicted. G: Morphology of representative EVs by electron microscopy from IMH cells treated as indicated; scale bar equals 100 nm. H: EV makers were confirmed by Western blotting for CD63 and Tsg101. The rightmost lane indicates molecular mass. *P < 0.05 compared with vehicle-treated cells.
Fig. 2.
Fig. 2.
EV release is IRE1α/XBP-1 dependent. A: EV response in primary mouse hepatocytes from WT and IRE1α hepatocyte-specific KO mice treated with 200 μM PA for 14 h. B: IMH from WT and IRE1α hepatocyte-specific KO mice (IRE1−/−) treated with 400 μM PA for 16 h. *P < 0.05 for PA-treated WT cells compared with vehicle (Veh). **P < 0.05 for PA-treated WT cells compared with KO. EV response in ATF6α WT and KO cells (C) and eIF2α phosphorylation resistant (AA) and WT (SS) cells treated with 400 μM PA or vehicle for 16 h (D). *P < 0.05 for PA-treated cells compared with vehicle. E: XBP-1 was knocked down in IMH cells using siRNA (siXBP1) and a nontargeting siRNA was used as a control (siCont). EVs were isolated using a commercially available polymer-based reagent. *P < 0.05 for PA-treated siCont cells compared with vehicle. **P < 0.05 for PA-treated siCont cells compared with siXBP1. F: EVs from XBP-1 deleted Huh7 (XBP1−/−) cells using the CRISPR/Cas9 genome editing technology, treated with 400 μM PA or vehicle for 16 h, were isolated using a commercially available polymer-based reagent. *P < 0.05 for PA-treated WT cells compared with vehicle. **P < 0.05 for PA-treated WT cells compared with XBP1−/−.
Fig. 3.
Fig. 3.
C16 ceramide synthesis is necessary for IRE1α-dependent PA-induced EV release. A: EVs isolated from WT or IRE1α KO (IRE1−/−) IMHs were treated with 400 μM PA or vehicle (Veh). The C16 ceramide content of EVs was measured by LC-MS/MS. EVs isolated from three independent experiments were pooled for lipidomics analysis. B: C16 ceramide was measured in whole cell pellets, under the same conditions as (A), and normalized to protein content. *P < 0.05 for the comparisons shown. C: EVs were isolated from IMHs treated with PA or vehicle, with or without 10 μM myriocin. *P < 0.05 for the comparisons shown. D: EVs isolated from WT or IRE1α KO (IRE1−/−) IMHs treated with 10 μM exogenous C16:0 ceramide (C16-Cer) or PA for 16 h. *P < 0.05 for the comparisons shown. E: EVs isolated from WT or IRE1α KO (IRE1−/−) IMHs treated with 50 and 100 μM exogenous C16:0 ceramide for 4 h. *P < 0.05 compared with vehicle-treated cells. F: EVs were isolated from IMHs treated with 10 μM exogenous C16 ceramide, 10 μM C2 ceramide, or 400 μM PA for 16 h. *P < 0.05 compared with vehicle-treated cells. G: WT or IRE1α KO (IRE1−/−) IMHs were treated with 400 μM PA or vehicle (Veh) for 4 h, and the expression of SPT1 mRNA was measured. *P < 0.05 for PA treated cells. H: IMHs were transfected with SPT1 siRNA or a control siRNA for 72 h. The efficiency of silencing was analyzed by SPT1 Western blotting (inset). EVs were isolated from PA- or vehicle-treated cells using a commercially available polymer, and from C16 ceramide-treated cells (100 μM, 4 h) with ultracentrifugation. *P < 0.05 for PA-treated cells; ns, not significant.
Fig. 4.
Fig. 4.
Lipotoxic EVs activate S1P receptor-mediated macrophage migration. A: Mouse BMDMϕs were migrated for 4 h toward EVs derived from equal numbers of cells treated with 400 μM PA or vehicle (Veh) for 16 h. B: BMDMϕs were pretreated with 5 μM PF543 or 1 μM ABC294640 for 1 h before migration toward lipotoxic EVs was assessed. C: Mouse macrophage cell line Raw246.7 (C) or BMDMϕs (D) were pretreated with 0.25 μM FTY720 or 1 μM W146 for 1 h before migration toward lipotoxic EVs was assessed. E: siRNA targeting S1P1 or control nontargeting siRNA were delivered to BMDMϕs, which were subsequently migrated for 4 h toward EVs derived from equal numbers of cells treated with 400 μM PA or vehicle for 16 h. The inverted gel image shows S1P1 expression in BMDMϕs treated with nontargeting siRNA (siCtrl) or S1P1 (siS1P1). *P < 0.05 and ** P < 0.001 for the comparisons shown.
Fig. 5.
Fig. 5.
C16:0 ceramide and S1P in murine NASH. A: Circulating EVs were measured in 100 μl of plasma from mice fed either chow (n = 9) or the FFC NASH-inducing diet (n = 10) for 24 weeks. C16:0 ceramide (B) and S1P (C) were measured in EVs isolated from 100 μl of plasma from the mice described in (A). C16:0 ceramide (D) and S1P (E) were measured in liver samples from the mice described in (A). *P < 0.05 for the comparisons shown.
Fig. 6.
Fig. 6.
C16:0 ceramide and S1P in human NASH. A: NAS for subjects with simple steatosis (n = 4) and early NASH F0-1 (n = 6). B: Circulating EVs were measured in 900 μl of plasma obtained from obese normal (n = 11), simple steatosis (n = 16), and early NASH F0-1 (n = 16). Particle concentration is expressed relative to the averaged obese normal. C16:0 ceramide (C) and S1P (D) were measured in EVs isolated from 900 μl of plasma from the subjects described in (B). C16:0 ceramide (E) and S1P (F) were measured in 25 μl of plasma samples from the subjects described in (A), in whom matching liver biopsy samples were available: obese normal (n = 4), simple steatosis (n = 4), and early NASH F0-1 (n = 6). C16:0 ceramide (G) and S1P (H) were measured in available liver biopsy samples from the subjects described in (E). *P < 0.05 by ANOVA for comparisons involving all three groups; **P < 0.05 for the comparisons shown across two experimental conditions.

Comment in

References

    1. Rinella M. E. 2015. Nonalcoholic fatty liver disease: a systematic review. JAMA. 313: 2263–2273. - PubMed
    1. Lassailly G., Caiazzo R., Buob D., Pigeyre M., Verkindt H., Labreuche J., Raverdy V., Leteurtre E., Dharancy S., Louvet A., et al. . 2015. Bariatric surgery reduces features of nonalcoholic steatohepatitis in morbidly obese patients. Gastroenterology. 149: 379–388. - PubMed
    1. Nehra V., Angulo P., Buchman A. L., and Lindor K. D.. 2001. Nutritional and metabolic considerations in the etiology of nonalcoholic steatohepatitis. Dig. Dis. Sci. 46: 2347–2352. - PubMed
    1. Malhi H., Bronk S. F., Werneburg N. W., and Gores G. J.. 2006. Free fatty acids induce JNK-dependent hepatocyte lipoapoptosis. J. Biol. Chem. 281: 12093–12101. - PubMed
    1. Kakisaka K., Cazanave S. C., Fingas C. D., Guicciardi M. E., Bronk S. F., Werneburg N. W., Mott J. L., and Gores G. J.. 2012. Mechanisms of lysophosphatidylcholine-induced hepatocyte lipoapoptosis. Am. J. Physiol. Gastrointest. Liver Physiol. 302: G77–G84. - PMC - PubMed

Publication types

MeSH terms