. 2015 Dec 1:4:e10453.
doi: 10.7554/eLife.10453.

Oviductal estrogen receptor α signaling prevents protease-mediated embryo death

Affiliations

Oviductal estrogen receptor α signaling prevents protease-mediated embryo death

Wipawee Winuthayanon et al. Elife. .

Abstract

Development of uterine endometrial receptivity for implantation is orchestrated by cyclic steroid hormone-mediated signals. It is unknown if these signals are necessary for oviduct function in supporting fertilization and preimplantation development. Here we show that conditional knockout (cKO) mice lacking estrogen receptor α (ERα) in oviduct and uterine epithelial cells have impaired fertilization due to a dramatic reduction in sperm migration. In addition, all successfully fertilized eggs die before the 2-cell stage due to persistence of secreted innate immune mediators including proteases. Elevated protease activity in cKO oviducts causes premature degradation of the zona pellucida and embryo lysis, and wild-type embryos transferred into cKO oviducts fail to develop normally unless rescued by concomitant transfer of protease inhibitors. Thus, suppression of oviductal protease activity mediated by estrogen-epithelial ERα signaling is required for fertilization and preimplantation embryo development. These findings have implications for human infertility and post-coital contraception.

Keywords: developmental biology; estrogen receptor; fertilization; innate immunity; mouse; oviduct; preimplantation embryo; stem cells.


Conflict of interest statement

The authors declare that no competing interests exist.

Figures

Figure 1.
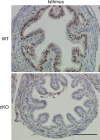
Figure 1.. Conditional deletion of estrogen receptor α (ERα) from cell type-selective regions of the oviduct.
Representative immunohistochemical analysis of ERα in the oviduct regions indicated from wild-type (WT), conditional knockout (cKO), and mesenchymal cKO mice. Scale bar = 100 μm. ERα protein expression in the cKO uterus was reported previously (Winuthayanon et al., 2010). DOI: http://dx.doi.org/10.7554/eLife.10453.003
Figure 1—figure supplement 1.
Figure 1—figure supplement 1.. Additional images showing immunohistochemical analysis of estrogen receptor α (ERα) in oviduct isthmus.
Wild-type (WT) and conditional knockout (cKO) are indicated. Epithelial cells in cKO completely lacked ERα signal, but no difference in smooth muscle or stromal staining was observed. Scale bar = 100 μm. DOI: http://dx.doi.org/10.7554/eLife.10453.004
Figure 2.
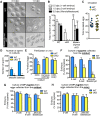
Figure 2.. Decreased fertilization and increased embryo death in oviducts lacking epithelial estrogen receptor α (ERα).
(A) Images of zygotes and two-cell embryos collected at 0.5 and 1.5 dpc from each genotype. Scale bar = 100 μm. (B) Total embryos collected at the indicated time points (n = 3–11 mice/group). *p< 0.05 vs WT at similar time-point; ns, no significant difference vs WT at similar time-point. (C) Total ovulated oocytes from WT and cKO females after stimulation with gonadotropins (n = 10–16 mice/group). (D) Number of sperm present in the indicated regions of WT and cKO oviducts following mating. Graph shows number of sperm within cumulus cell masses in the ampulla (n = 5 mice/group) and relative number of sperm flushed from the isthmus region (n = 6 mice/group). *, significant difference compared to WT at designated location, Mann–Whitney test, p <0.01. (E) IVF efficiency. Cumulus-oocyte complexes (COCs) were collected from the oviducts or ovaries of superovulated WT and cKO females and then inseminated. Cumulus cells were removed from one set of oviduct COCs prior to insemination (cumulus cell-free). Graph indicates the percentage of eggs fertilized out of the total collected (n = 5–7 mice/group). (F) Development in vitro of zygotes collected from oviducts of WT and cKO mice. Embryo morphology recorded after 24 hr (two-cell stage), 48 hr (four- to eight-cell stage), and 72 hr (morula and blastocyst stages) (n = 4–5 mice/group). (G,H) Development in vitro of zygotes generated by IVF of oocytes from (G) oviducts (n = 5–7 mice/group) or (H) ovaries of WT and cKO mice (n = 5–7 mice/group). All graphs represent mean ± SEM. *, significant difference compared to WT at designated time point, p<0.05. cKO: Conditional knockout; dpc: Days post coitum; IVF: In vitro fertilization; WT: Wild-type. DOI: http://dx.doi.org/10.7554/eLife.10453.005
Figure 2—figure supplement 1.
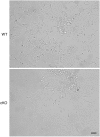
Figure 2—figure supplement 1.. Representative images of sperm flushed from oviductal isthmus of wild-type (WT) and conditional knockout (cKO) mice.
Scale bar = 20 μm. DOI: http://dx.doi.org/10.7554/eLife.10453.006
Figure 3.
Figure 3.. Validation of up- and down-regulated genes in conditional knockout (cKO) compared to Wild-type (WT) oviducts at 0.5 and 1.5 dpc using real-time PCR analysis.
The transcripts were selected from microarray datasets for over- and under-expression in cKO oviducts compared to WT at 0.5 or 1.5 dpc, as indicated (n = 4–7 mice/group; mean ± SEM). Data represents relative expression level normalized to Rpl7. *, significant difference compared to WT at same time point, p<0.05. dpc: Days post coitum. DOI: http://dx.doi.org/10.7554/eLife.10453.007
Figure 4.
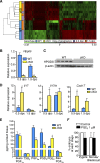
Figure 4.. Aberrant oviduct innate immune function in the absence of oviductal epithelial estrogen receptor α (ERα).
(A) Unsupervised hierarchical clustering of microarray data from wild-type (WT) and conditional knockout (cKO) oviducts at 0.5 and 1.5 dpc. Using a 1.5-fold cutoff, 3263 probes were significantly different between WT and cKO oviducts at 0.5 dpc, whereas only 321 probes were different at 1.5 dpc. The heat map shows log2 transformed and standardized g Processed Signals (signal intensities). Green color represents probes with intensity less than mean; red color represents probes with intensity more than mean. Each horizontal bar represents data from a single animal; n = 4 mice/group. (B) Real-time PCR of hematopoietic prostaglandin D synthase (Hpgds) transcript in WT and cKO oviducts at 0.5 and 1.5 dpc (n = 4–7 mice/group). (C) Immunoblot of HPGDS expression in WT and cKO oviducts at 0.5 dpc; β-actin was used as a loading control. Protein lysate from one mouse in each lane; n = 4–5 mice/group. (D) Real-time PCR of interleukin-17 (Il17), interleukin-17 receptor b (Il17rb), and chemokine (CXC motif) ligand 17 (Cxcl17)transcripts in WT and cKO oviducts at 0.5 and 1.5 dpc (n = 4–7 mice/group). (E) Prostaglandin profile in whole oviduct tissues from WT and cKO at 0.5 dpc. 6ketoPGF, 6-keto-prostaglandin F; TXB2, thromboxane B2; PGF, prostaglandin F; PGD2, prostaglandin D2; PGE2, prostaglandin E2; and 8isoPGF, 8-iso-prostaglandin F (n = 6–7 mice/group). (F) Number of fertilized eggs (zygotes) after insemination in the presence of PGE2 and number of morulae and blastocysts 3 days after treating zygotes with 1 μM PGE2 as compared to vehicle control (n = 36–40 oocytes/group). For all panels, graphs represent mean ± SEM and asterisks indicate significant difference compared to WT at designated time point, p<0.05. dpc: Days post coitum; HPGDS: hematopoietic prostaglandin D synthase. DOI: http://dx.doi.org/10.7554/eLife.10453.008
Figure 5.
Figure 5.. Alterations in expression of proteases and protease inhibitors in oviducts lacking epithelial estrogen receptor α (ERα).
Real-time PCR of the indicated (A) proteases and (B) protease inhibitors in wild-type (WT) and conditional knockout (cKO) oviducts at 0.5 dpc (n = 4–7 mice/group; mean ± SEM). (C) Immunoblot analysis of fetuin B in WT and cKO oviducts; β-actin served as a loading control. Protein lysate from one mouse in each lane; n = 4–5 mice/group. (D) Quantitation of fetuin B signal intensity normalized to β-actin. (E) Fetuin B localization in WT and cKO oviducts at 0.5 dpc. Images shown are representative of n = 4 mice/group. Scale bar = 50 μm. For all panels, asterisk indicates significant difference compared to WT, p<0.05. dpc: Days post coitum. DOI: http://dx.doi.org/10.7554/eLife.10453.014
Figure 5—figure supplement 1.
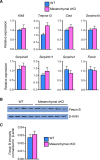
Figure 5—figure supplement 1.. Comparable expression of proteases and protease inhibitors in wild-type (WT) and mesenchymal conditional knockout (cKO) oviduct at 0.5 dpc.
(A) Real-time PCR of the indicated proteases and protease inhibitors in WT and mesenchymal cKO oviducts at 0.5 dpc (n = 4–6 mice/group; mean ± SEM). (B) Immunoblot analysis and (C) normalized signal intensities of fetuin B protein to β-actin in WT and mesenchymal cKO oviducts at 0.5 dpc. dpc: Days post coitum. DOI: http://dx.doi.org/10.7554/eLife.10453.015
Figure 6.
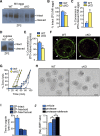
Figure 6.. Zona pellucida alterations due to elevated protease activity in oviducts lacking epithelial estrogen receptor α (ERα).
(A) Immunoblot analysis of ZP2 protein in eggs retrieved from wild-type (WT) and conditional knockout (cKO) oviducts ∼4 hr after ovulation. Eight eggs from one mouse/lane. (B,C) Quantitation of the percentage intact ZP2 protein (B) and percentage conversion from intact ZP2 to cleaved ZP2 (C) in ovulated eggs from WT and cKO oviducts (n = 6 mice/group); *p<0.05. (D) Immunoblot analysis of ZP2 in zygotes retrieved from WT and cKO oviducts ∼10 hr after fertilization. Ten zygotes pooled from 3 mice per lane. (E) Percentage conversion from intact ZP2 to cleaved ZP2 in zygotes from WT and cKO oviducts. Graph presents data from 7 pools of 10 embryos per group; mean ± SEM. *p <0.05, T-test. (F) Images of zygotes from WT and cKO oviducts stained for cortical granules. Arrowheads indicate cortical granule contents in the perivitelline space. Scale bar = 20 μm. (G) Percentage ZP lysis over time in zygotes retrieved from WT and cKO oviducts and incubated in 0.2% α-chymotrypsin. Each line represents data from one mouse. (H) Images of WT and cKO zygotes after 90 min incubation in 0.2% α-chymotrypsin (n = 3–4 mice/group). Scale bar = 50 μm. (I) Time to lysis for zygotes cultured in 0.4% α-chymotrypsin with ZP either intact or removed using treatment with acidic Tyrode’s solution or manual microdissection, as indicated. Graph presents data from 15–21 embryos per treatment over three independent experiments; mean ± SEM. *p<0.05, ANOVA. (J) [Na]i in WT zygotes exposed to vehicle, 0.2% α-chymotrypsin (protease), or 0.2% α-chymotrypsin and recombinant defensins (protease defensin). Graph shows relative [Na]i as indicated by SBFI 340/380 ratio (n = 10–12 embryos/group; mean ± SEM). *p <0.05, ANOVA. cKO: Conditional knockout; MII: Metaphase II; [Na]i: Intracellular sodium; SBFI: Sodium-binding benzofuran isophthalate;WT: Wild-type; ZP: Zona pellucida. DOI: http://dx.doi.org/10.7554/eLife.10453.016
Figure 6—figure supplement 1.
Figure 6—figure supplement 1.. Morphology of WT zygotes after exposure to defensins.
Zygotes were incubated at 37°C in the presence of vehicle (PBS) or a combination of α-defensin 1 and β-defensin 3 recombinant proteins, each at a concentration of 0.5, 5, or 50 μg/mL. Pictures were taken at the indicated time-points. Scale bar = 50 μm. DOI: http://dx.doi.org/10.7554/eLife.10453.017
Figure 7.
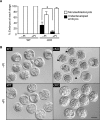
Figure 7.. Excessive protease activity in vivo in the conditional knockout (cKO) oviduct leads to embryo development failure.
(A) Percentage of underdeveloped embryos and morula/blastocyst stage embryos retrieved from pseudopregnant wild-type (WT) and cKO recipients that received no protease inhibitors (–PI) or received protease inhibitors ( PI) during embryo transfer (n = 5–12 mice/group and 42–64 embryos/group; mean ± SEM, *p <0.05). (B) Representative images of embryos retrieved from WT and cKO recipients at 3.5 dpc in –PI and PI groups. Arrowheads indicate examples of underdeveloped embryos. Scale bars = 50 μm. DOI: http://dx.doi.org/10.7554/eLife.10453.021
Figure 8.
Figure 8.. Schematic describing how estrogen receptor α (ERα) in oviduct epithelial cells supports fertilization and early embryo development.
(A) In wild-type mice, estrogen signals to ERα in both stromal and epithelial cells to suppress secretion of innate immune mediators and generate a luminal environment supportive of sperm migration, fertilization, and preimplantation embryo development. (B) In mice lacking ERα in oviduct epithelial cells, estrogen signaling to stromal cells alone cannot suppress secretion of oviduct immune mediators, resulting in increased protease activity. There is a failure of sperm migration, impaired fertilization, and lysis of successfully fertilized embryos. Embryos can be rescued by inserting protease inhibitors into the oviduct lumen. (C) In mice lacking ERα in oviduct stromal cells, the luminal environment fully supports fertilization and embryo development. DOI: http://dx.doi.org/10.7554/eLife.10453.022

References

    1. Aboud L, Ball TB, Tjernlund A, Burgener A. The role of serpin and cystatin antiproteases in mucosal innate immunity and their defense against HIV. American Journal of Reproductive Immunology . 2014;71:12–23. doi: 10.1111/aji.12166. - DOI - PubMed
    1. Beek J, Nauwynck H, Maes D, van Soom A. Inhibitors of zinc-dependent metalloproteases hinder sperm passage through the cumulus oophorus during porcine fertilization in vitro. Reproduction . 2012;144:687–697. doi: 10.1530/REP-12-0311. - DOI - PubMed
    1. Bernhardt ML, Kim AM, O'Halloran TV, Woodruff TK. Zinc requirement during meiosis i-meiosis II transition in mouse oocytes is independent of the MOS-MAPK pathway. Biology of Reproduction. 2011;84:526–536. doi: 10.1095/biolreprod.110.086488. - DOI - PMC - PubMed
    1. Beyler SA, James KP, Fritz MA, Meyer WR. Hydrosalpingeal fluid inhibits in-vitro embryonic development in a murine model. Human Reproduction . 1997;12:2724–2728. doi: 10.1093/humrep/12.12.2724. - DOI - PubMed
    1. Bortner CD, Gomez-Angelats M, Cidlowski JA. Plasma membrane depolarization without repolarization is an early molecular event in anti-fas-induced apoptosis. The Journal of Biological Chemistry. 2001;276:4304–4314. doi: 10.1074/jbc.M005171200. - DOI - PubMed

Publication types