. 2016 Jan 5;7(1):66-80.
doi: 10.18632/oncotarget.6384.

Prohibitin overexpression improves myocardial function in diabetic cardiomyopathy

Affiliations

Prohibitin overexpression improves myocardial function in diabetic cardiomyopathy

Wen-qian Dong et al. Oncotarget. .

Abstract

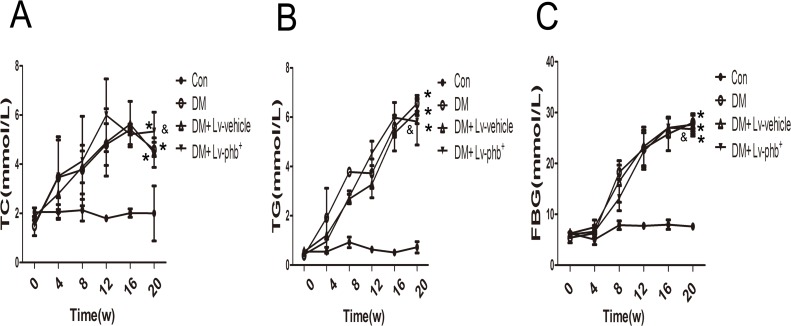
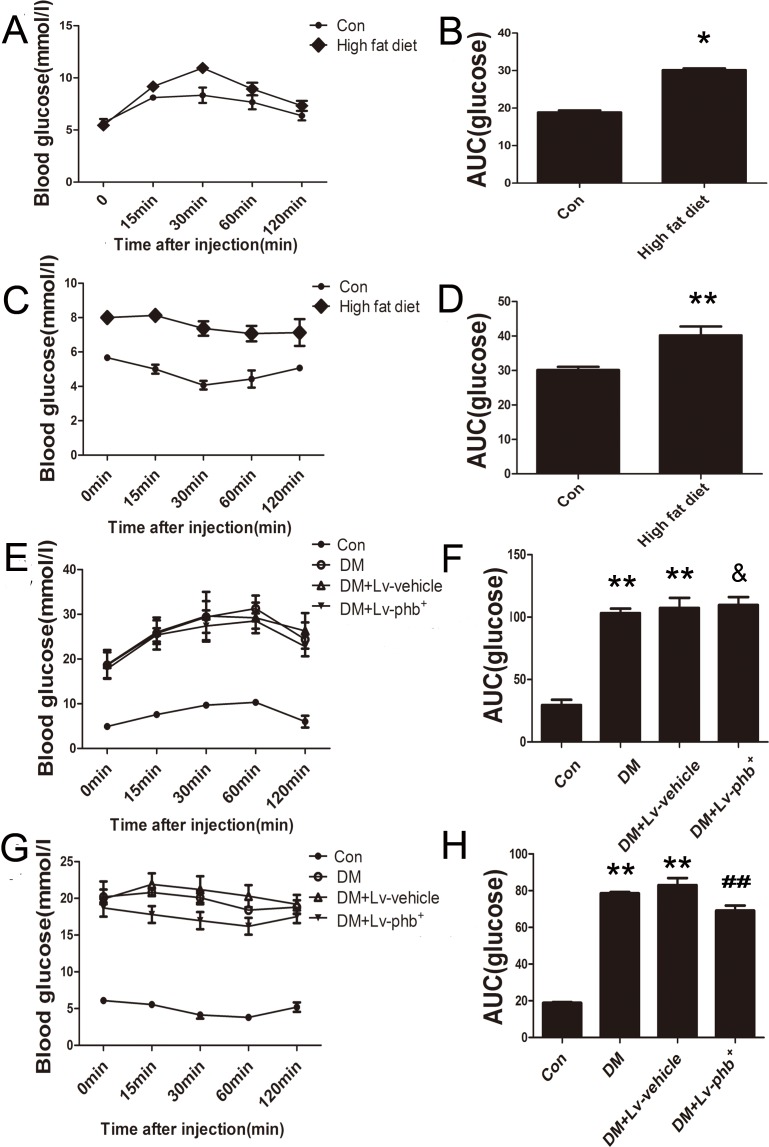
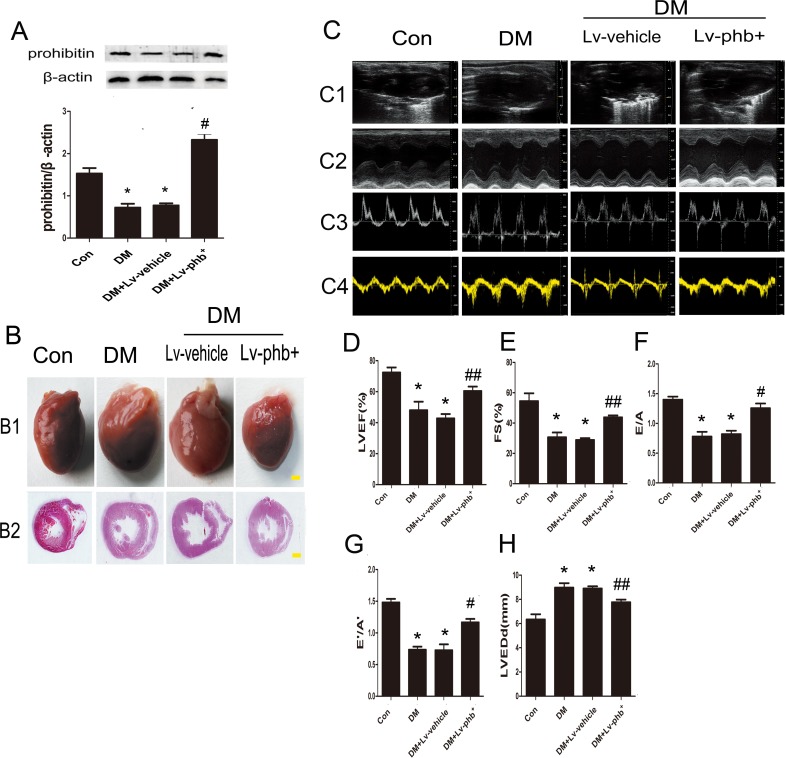
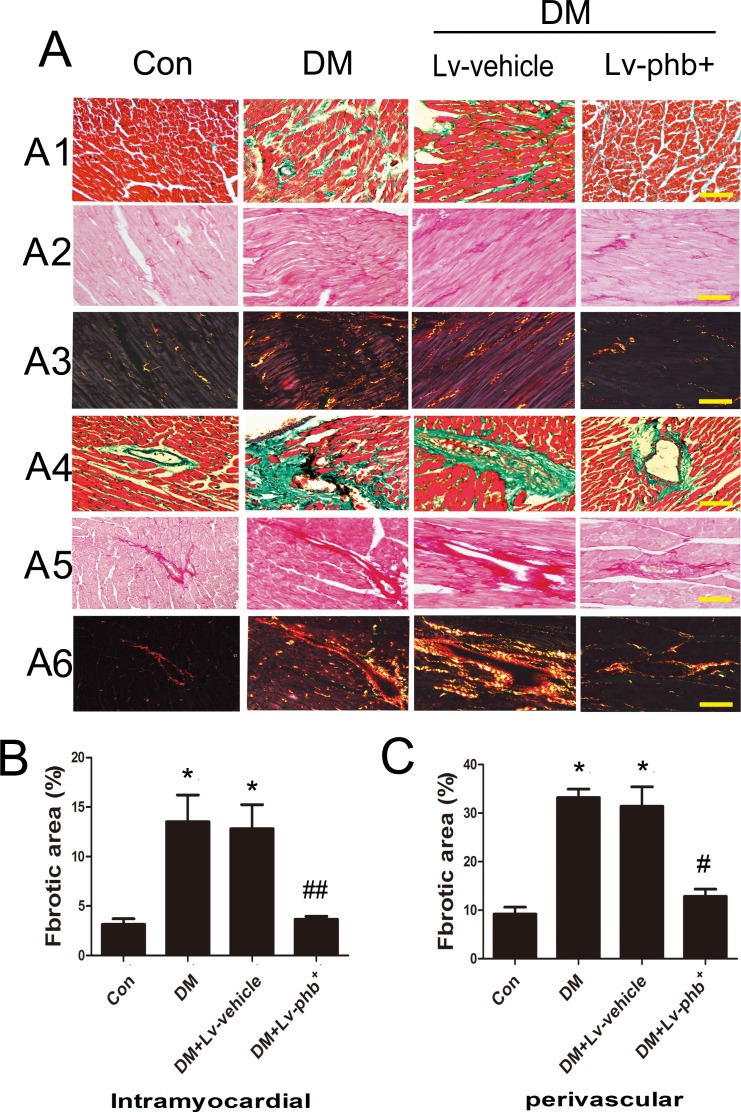
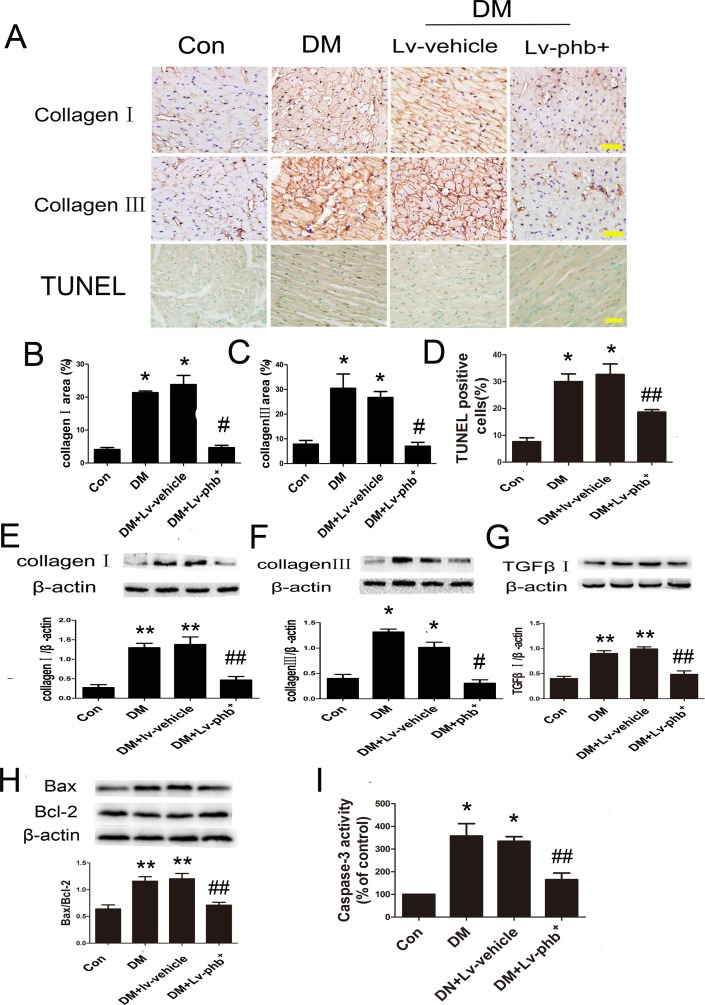
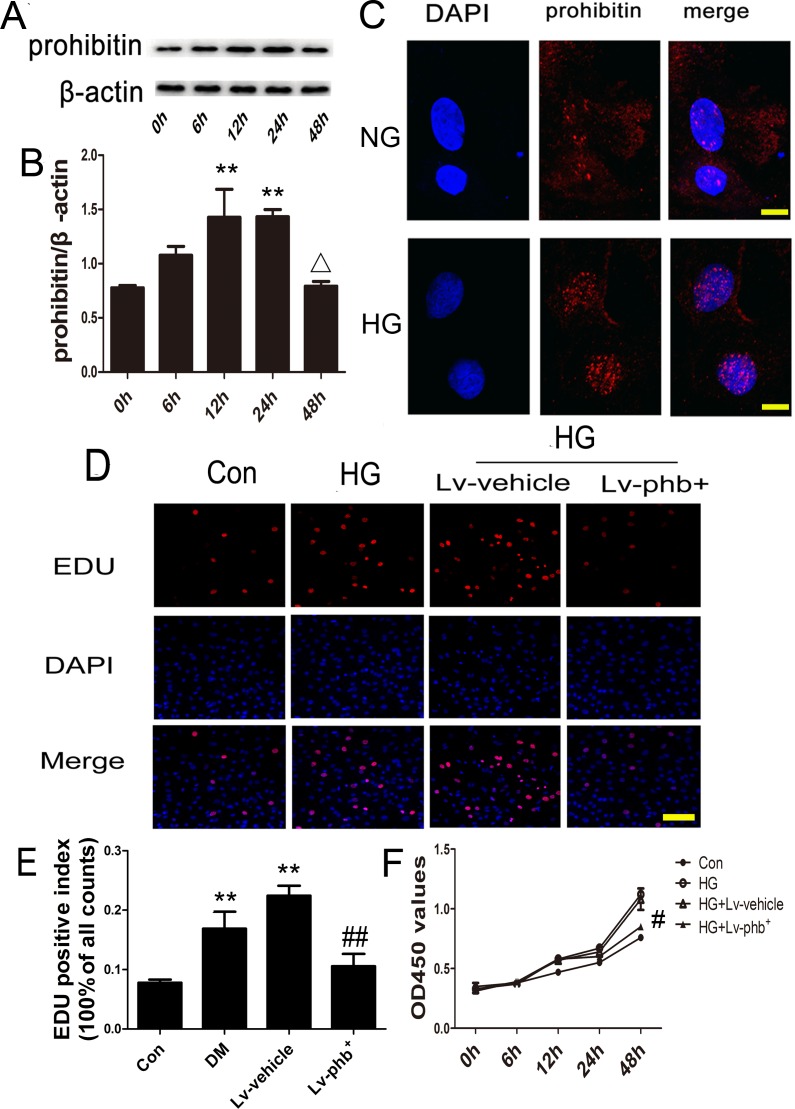
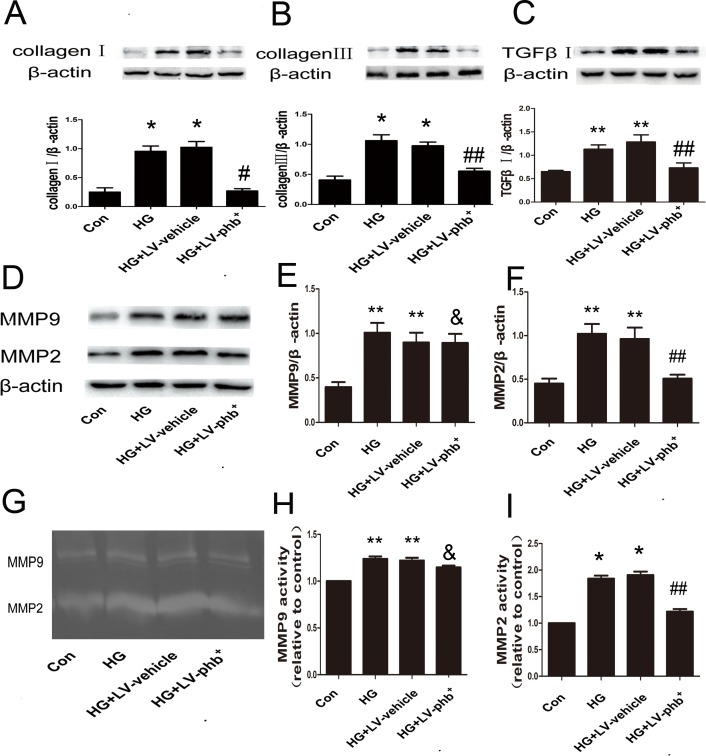
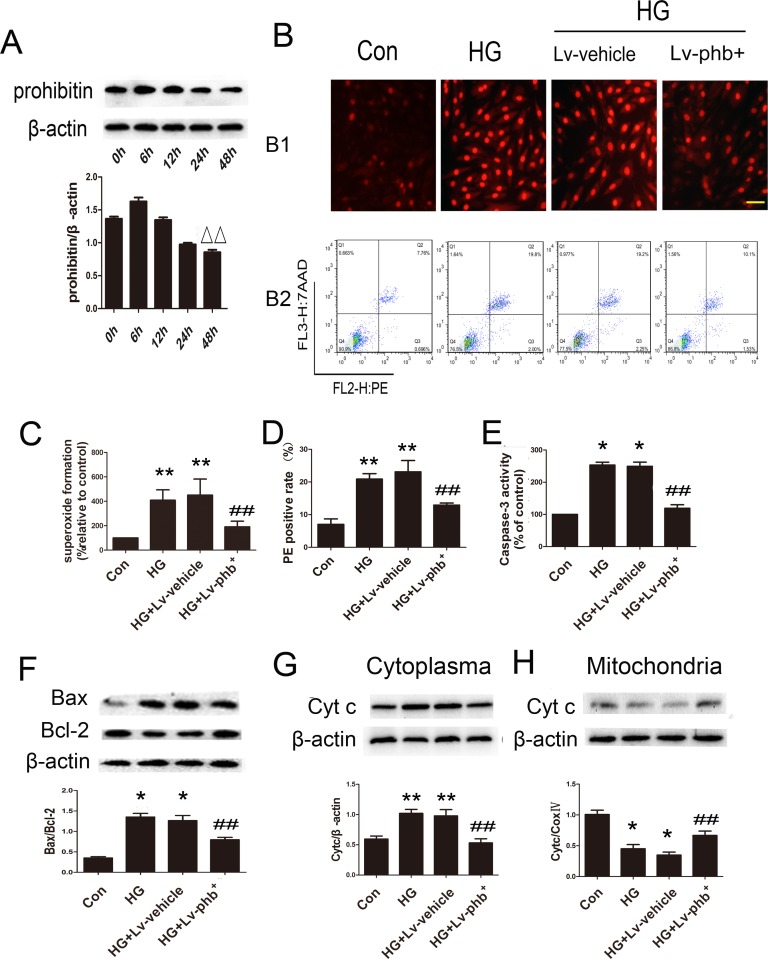
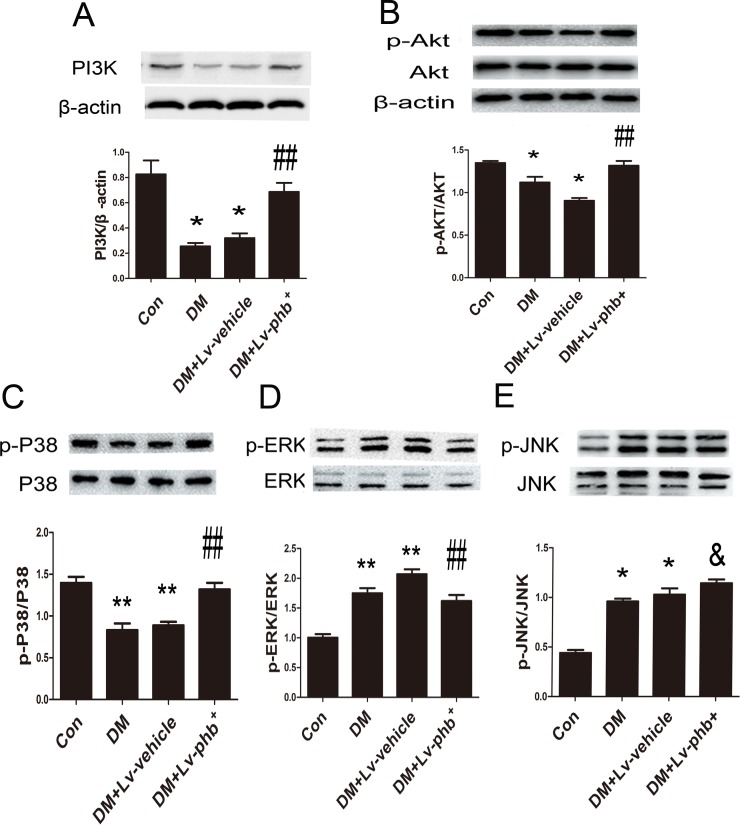
Prohibitin (PHB) is a highly conserved protein implicated in various cellular functions including proliferation, apoptosis, tumor suppression, transcription, and mitochondrial protein folding. However, its function in diabetic cardiomyopathy (DCM) is still unclear. In vivo, type 2 diabetic rat model was induced by using a high-fat diet and low-dose streptozotocin. Overexpression of the PHB protein in the model rats was achieved by injecting lentivirus carrying PHB cDNA via the jugular vein. Characteristics of type 2 DCM were evaluated by metabolic tests, echocardiography and histopathology. Rats with DCM showed severe insulin resistance, left ventricular dysfunction, fibrosis and apoptosis. PHB overexpression ameliorated the disease. Cardiofibroblasts (CFs) and H9c2 cardiomyoblasts were used in vitro to investigate the mechanism of PHB in altered function. In CFs treated with HG, PHB overexpression decreased expression of collagen, matrix metalloproteinase activity, and proliferation. In H9c2 cardiomyoblasts, PHB overexpression inhibited apoptosis induced by HG. Furthermore, the increased phosphorylation of extracellular signal-regulated kinase (ERK) 1/2 was significantly decreased and the inhibited phosphorylation of Akt was restored in DCM. Therefore, PHB may be a new therapeutic target for human DCM.

Keywords: Pathology Section; apoptosis; diabetic cardiomyopathy; myocardial fibrosis; prohibitin.


Conflict of interest statement

CONFLICTS OF INTEREST

None declared.

Figures

Figure 1
Figure 1. Basic characteristics of rats
A. Total cholesterol (TC) level. B. Triglyceride (TG) level. C. Fasting blood glucose (FBG) level. Con: normal rats, DM: diabetic rats. Lv: lentiviral vector. Data are mean ± SEM. *P < 0.01 vs. Con; &P > 0.05 vs. DM or DM + Lv-vehicle.
Figure 2
Figure 2. Intraperitoneal Glucose Tolerance Test (IPGTT) and Intraperitoneal Insulin Tolerance Test (IPITT)
A. and B. Blood glucose and area under the receiver operating characteristic curve (AUC) for the IPGTT in rats at 4 weeks after induction of diabetes. C. and D. Blood glucose and AUC for the IPITT in rats at 4 weeks after induction of diabetes. (E and F) Blood glucose and AUC for the IPGTT in rats at 20 weeks after induction of diabetes. G. and H. Blood glucose and AUC for the IPITT in rats at 20 weeks after induction of diabetes. Con: normal rats, DM: diabetic rats, Lv: lentiviral vector. Data are mean ± SEM. *P < 0.01, **P < 0.05 vs. Con; & P > 0.05, ##P < 0.05 vs. DM or DM+Lv-vehicle.
Figure 3
Figure 3. Prohibitin (PHB) expression improves cardiac dysfunction in diabetes rats
A. Western blot analysis of PHB protein levels and quantitative analysis. B1. Heart sizes of the rats under different treatments (bar: 2mm). B2. Representative histological cross-sections of papillary muscle (bar: 2mm). C1. Representative 2D echocardiograms. C2. M-mode echocardiograms. C3. Pulsed-wave Doppler echocardiograms of mitral inflow. C4. Tissue Doppler echocardiograms. Quantitative analysis of LV ejection fraction (LVEF) D., fractional shortening (FS) E., early to late mitral flow (E/A) F., ratio of diastolic mitral annulus velocities (E'/A') G., and LV end-diastolic dimension (LVEDd) H. Con: normal rats, DM: diabetic rats, Lv: lentiviral vector. Data are mean ± SEM. *P < 0.01 vs. Con; #P < 0.01, ##P < 0.05 vs. DM or DM+Lv-vehicle.
Figure 4
Figure 4. Effect of PHB on collagen deposition
A1. Masson'strichrome staining of the intramyocardial area of rat heart (bar: 100μm). A2.–A3. Picrosirius red staining of the intramyocardial area (bar: 100μm). A4. Masson'strichrome staining of perivascular area (bar: 100μm). A5.-A6. Picrosirius red staining of the perivascular area (bar: 100m). B. Fibrotic area of the intramyocardial area. C. Fibrotic area of the perivascular area. Con: normal rats, DM: diabetic rats, Lv: lentiviral vector. Data are mean ± SEM. *P < 0.01 vs. Con; #P < 0.01, ##P < 0.05 vs. DM or DM+Lv-vehicle.
Figure 5
Figure 5. Effect of PHB on collagen deposition and apoptosis in vivo
A. Immunostaining of collagen I (upper panels), collagen III (middle panels), Terminal Deoxynucleotidyl Transferase dUTP Nick End Labeling (TUNEL) staining of myocardium (lower panels) (bar: 50μm) and quantification of collagen I area B., collagen III area C., and apoptosis rate D. E.–G. Western blot analysis and quantification of protein expression of collagen I and III and TGF-β1 in rats. H. Western blot analysis and quantification of Bcl2-associated X protein (Bax) and B-cell leukemia/lymphoma-2 (Bcl-2). I. Quantification of caspase-3 activity as % of control. Con: normal rats or normal glucose (NG: 5.5mM), DM: diabetic rats, Lv: lentiviral vector. Data are mean ± SEM. *P < 0.01, **P < 0.05 vs. Con; #P < 0.01, ##P < 0.05, vs. DM or DM+Lv-vehicle.
Figure 6
Figure 6. HG effect on PHB production in CFs and PHB overexpression inhibiting CF proliferation
A. Cardiofibroblasts (CFs) were stimulated with HG for various periods; western blot analysis of protein expression of PHB, and B. quantification. C. Immunocytochemistry for PHB localization after NG and HG treatment (bar: 10μm). PHB is stained red; nuclei were counterstained with DAPI (blue). D. Laser confocal microscopy of 5-ethynyl-2-deoxyuridine (EdU) staining (bar: 100μm). E. EdU-positive index expressed as % of cell counts. F. Cell Counting Kit-8 analysis the cell viability of CFs treated with glucose for various times. Con: normal glucose (NG: 5.5mM); HG: 30mM glucose, Lv: lentiviral vector. Data are mean ± SEM. **P < 0.05 vs. Con; ΔP < 0.05 vs. 24 h. #p<0.01, ##P < 0.05 vs. HG or HG+Lv-vehicle.
Figure 7
Figure 7. Effect of PHB on protein expression of collagen and MMPs in CFs
A.–C. Western blot analysis of protein expression of collagen I and III and TGF-β1 in CFs. D. Western blot analysis of matrix metalloproteinase 9 (MMP-9) and MMP-2 protein levels and E., F. quantification. G. Gelatin zymography of activity of MMP-2 and MMP-9 and H., I. quantification. Con: normal glucose (NG: 5.5mM), HG: 30mM glucose, Lv: lentiviral vector. Data are mean ± SEM. *P < 0.01, **P < 0.05 vs. Con; &P > 0.05, #p<0.01, ##P < 0.05, vs. HG or HG+Lv-vehicle.
Figure 8
Figure 8. Role of PHB in ROS accumulation and apoptosis
A. H9c2 cardiomyoblasts were stimulated with HG for various periods; western blot analysis of protein expression of PHB and quantification. B1. Dihydroethidium (DHE) staining of H9c2 cardiomyoblasts and C., quantification (bar: 50μm). B2. Flow cytometry with phycoerythrin(PE)/7-amino-actinomycin D (7-AAD) staining to determine cell apoptosis. D. Quantitative analysis of PE positive rate. E. Quantification of caspase-3 activity as % of control. F. Western blot analysis and quantification of Bax and Bcl-2. G. and H. Western blot analysis and quantification of cytochrome c. Con: normal rats or normal glucose (NG: 5.5mM), DM: diabetic rats, HG: 30mM glucose, Lv: lentiviral vector. Data are mean ± SEM. ΔΔP < 0.05 vs. 6 h. *P < 0.01, **P < 0.05 vs. Con. ##P < 0.05 vs. HG or HG+Lv-vehicle.
Figure 9
Figure 9. Signal-transduction mechanisms in PHB functioning in myocardium
A.-E. Western blot analysis of PI3K, p-Akt, phospho-extracellular signal-regulated kinase (p-ERK), p-p38 and p-Jun NH2-terminal kinase (p-JNK). Con: normal rats, DM: diabetic rats. Lv: lentiviral vector. Data are mean ± SEM. *p < 0.01, **p < 0.05 vs. Con; & P > 0.05, ##P < 0.05 vs. DM or DM+Lv-vehicle.

References

    1. Chen J, Zhang Z, Cai L. Diabetic cardiomyopathy and its prevention by nrf2: Current status. Diabetes & Metabolism Journal. 2014;38:337–345. - PMC - PubMed
    1. Poornima IG, Parikh P, Shannon RP. Diabetic cardiomyopathy: The search for a unifying hypothesis. Circulation Research. 2006;98:596–605. - PubMed
    1. Schannwell C, Schneppenheim M, Perings S, Plehn G, Strauer B. Left ventricular diastolic dysfunction as an early manifestation of diabetic cardiomyopathy. Cardiology. 2002;588:33–39. - PubMed
    1. Boudina S, Abel ED. Diabetic cardiomyopathy, causes and effects. Reviews in Endocrine & Metabolic Disorders. 2010;11:31–39. - PMC - PubMed
    1. Asbun J, Villarreal FJ. The pathogenesis of myocardial fibrosis in the setting of diabetic cardiomyopathy. Journal of the American College of Cardiology. 2006;47:693–700. - PubMed

Publication types

MeSH terms