. 2015 Dec 1:6:10006.
doi: 10.1038/ncomms10006.

ENPP1-Fc prevents mortality and vascular calcifications in rodent model of generalized arterial calcification of infancy

Affiliations

ENPP1-Fc prevents mortality and vascular calcifications in rodent model of generalized arterial calcification of infancy

Ronald A Albright et al. Nat Commun. .

Abstract

Diseases of ectopic calcification of the vascular wall range from lethal orphan diseases such as generalized arterial calcification of infancy (GACI), to common diseases such as hardening of the arteries associated with aging and calciphylaxis of chronic kidney disease (CKD). GACI is a lethal orphan disease in which infants calcify the internal elastic lamina of their medium and large arteries and expire of cardiac failure as neonates, while calciphylaxis of CKD is a ubiquitous vascular calcification in patients with renal failure. Both disorders are characterized by vascular Mönckeburg's sclerosis accompanied by decreased concentrations of plasma inorganic pyrophosphate (PPi). Here we demonstrate that subcutaneous administration of an ENPP1-Fc fusion protein prevents the mortality, vascular calcifications and sequela of disease in animal models of GACI, and is accompanied by a complete clinical and biomarker response. Our findings have implications for the treatment of rare and common diseases of ectopic vascular calcification.


Conflict of interest statement

R.A.A. and D.T.B. are co-inventors of a pending patent application owned by Yale University related to these studies. Z.C., K.B. and Z.-X.Y. are employees of Alexion Pharmaceuticals, Inc. The remaining authors declare no competing financial interest.

Figures

Figure 1
Figure 1. Natural history study.
(a) Daily weights of enpp1wt (cyan squares, n=9 animals) and enpp1asj/asj mice (green circles, n=8 animals) on the acceleration diet in utero over a 70 day period. Mean average weights are plotted with s.d's denoted by error bars. A failure to thrive point is noted in the enpp1asj/asj cohort at day 26, when the weights diverge from enpp1wt. Death events are marked with red arrows. (b) Mean survival of enpp1asj/asj was 58 days. No deaths were observed in the enpp1wt cohort. Analysis by log-rank (Mantle–Cox) test yields a χ2 of 15.73 and P value of <0.0001. (c) enpp1asj/asj animals displayed dramatic calcifications in heart and aorta visible on micro-CT scans. (d,e) Histology of enpp1asj/asj mice, aorta (Hematoxylin and Eosin (H&E) and Alizarin red). Aortas of enpp1asj/asj mouse all possessed near circumferential calcifications that were pervasive in the vascular walls, as illustrated by Alizarin red staining of the aortas. Scale bar, 20 μm (f). Histology of enpp1asj/asj mice, left ventricle. Extensive calcifications surrounded by scar tissue revealing the presence of repeated, old and healed myocardial infarctions. Scale bar, 10 μm (g). Histology of enpp1asj/asj Mice, Septum (H&E). More typically, the enpp1asj/asj mice displayed small foci of calcifications with surrounding scar tissue as seen here in the myocardial septum, also diagnostic of previous myocardial infarctions. Scale bar, 10 μm.
Figure 2
Figure 2. Metabolic pathways and therapeutic design.
(a) Metabolic pathways of interest. ENPP1 converts extracellular ATP into AMP and PPi, TNAP converts PPi into Pi, and CD73 converts AMP into adenosine and Pi. ABCC6 is a membrane transporter that increases the extracellular concentration of NTP via an indirect unknown mechanism (shown as a dashed line). Loss of function mutations in TNAP result in familial hypophosphatasia. Loss of function mutations in ENPP1 result in GACI, loss of function mutations in ABCC6 result in pseudoxanthomatous elasticum, and loss of function mutations in CD73 results in a disease of arterial and joint calcification termed ‘ACDC'. TNAP, tissue-nonspecific alkaline phosphatase. (b) Design of ENPP1 protein therapeutic. To produce a soluble recombinant protein, a segment of the extracellular region of NPP2 containing a furin cleavage site was substituted into ENPP1 (ref. 26) and the Fc portion of IgG1 was appended to the c-terminus.
Figure 3
Figure 3. Steady state kinetics of hENPP1-Fc.
Time courses of AMP formation measured by HPLC analysis after addition of (a) 50 nM hNPP1 purified from sf9 cells to (from bottom to top) 3.9 (black), 7.8 (red), 15.6 (green), 31.3 (blue), 62.5 (cyan), 125 (magenta), 250 (dark yellow) and 500 (navy) μM ATP or (b) 10 nM hNPP1 from HEK293 cells to (from bottom to top) 7.8 (black), 15.6 (red), 31.3 (green), 62.5 (blue), 125 (cyan) and 250 (magenta) μM ATP. The smooth curves though the data are fits obtained by non-linear kinetic time course analysis. (c) Comparison of ENPP1 expressed in insect cells with ENPP1-Fc expressed in mammalian cells. NPP1 (sf9, black circles) is human ENPP1 produced in baculovirus-infected cells while NPP1 (HEK293, Fc and blue squares) is human ENPP1-Fc produced in HEK293 cells. The initial rate of ATP cleavage by ENPP1-Fc from HEK293 cells is essentially the same at [ATP] greater than 7.8 μM, yielding a kcat (the average of the rates ⩾7.8 μM) of 3.4 (±0.4) s−1 per enzyme. The initial rate at 2.0 μM ATP concentration is about a half of the kcat value. We therefore estimate a KM ∼ 2 μM for ATP hydrolysis by hNPP1-Fc protein. (d) ATP concentration dependence of the initial hydrolysis rate of ENPP1 (no Fc) purified from HEK293 cells. The reaction displays a kcat of 3.46 (±0.44) s−1 per enzyme, estimated from the average of all ATP concentrations ⩾2 μM. At 1 μM initial ATP (the first data point), the hydrolysis rate is slightly less than kcat values. We therefore estimate a KM <2 μM for ATP hydrolysis by ENPP1 (no Fc) purified from HEK293 cells.
Figure 4
Figure 4. Characterization of ENPP1-Fc.
(a) Pharmacokinetics of absorption and excretion. 15 C57B6 mice were injected with 10 mg kg−1 ENPP1-Fc and blood was collected at the indicated times. The concentration of ENPP1-Fc was estimated from the activity units of enzyme as measured by TMP assay and each data point represents measurement in 5 animals except for time=0, which represents 15 animals. The mean value is plotted, and error bars represent s.d. in the measurements. A Cmax of ≈300 nM is reached at 8 h, and the area under the curve is calculated as 9 μM h−1. (b) To derive the pharmacokinetic constants of drug absorption and elimination we plotted the fraction of dosed drug absorbed in the plasma from a single 10 mg kg−1 subcutaneous dose over time and fit the resulting curve with the equation formula image to obtain the elimination and absorption constants ke and ka, respectively. The resulting curve yielded values for ke=0.107±0.016 h−1 and ka=0.048±0.008 h−1. The goodness of the fit yielded an R2=0.7573 and an absolute sum of squares=0.01. (c) Stability of ENPP1 therapeutic. ENPP1-Fc Ap3A activity was seen to be stable to freeze-thaw cycle in PBS following storage at −80 °C. (d) Molecular weight of ENPP1-Fc determined by SEC-MALLS/RI/UV. Weight average molar masses (Mw) are plotted for analyses of ENPP1-Fc protein at various concentrations. Lines correspond to UV traces of the protein eluting from the SEC column monitored at 280 nm (left axis). Molar masses were recorded every sec across the elution profile (circles; right axis); for clarity only every 20th measurement of molar mass is plotted. ENPP1-Fc protein was analysed in a concentration range from 100 nM (dashed line, empty circles) to 1 μM (solid line, filled circles) measured at the apex of the eluting peak. The elution's position of protein standards used for validation of SEC-MALLS/UV/RI performance are marked. The SEC-MALLS/UV/RI analysis yielded MW of 274±38 KDa with a glycosylation estimate of 0.05 g of sugars per gram of polypeptide.
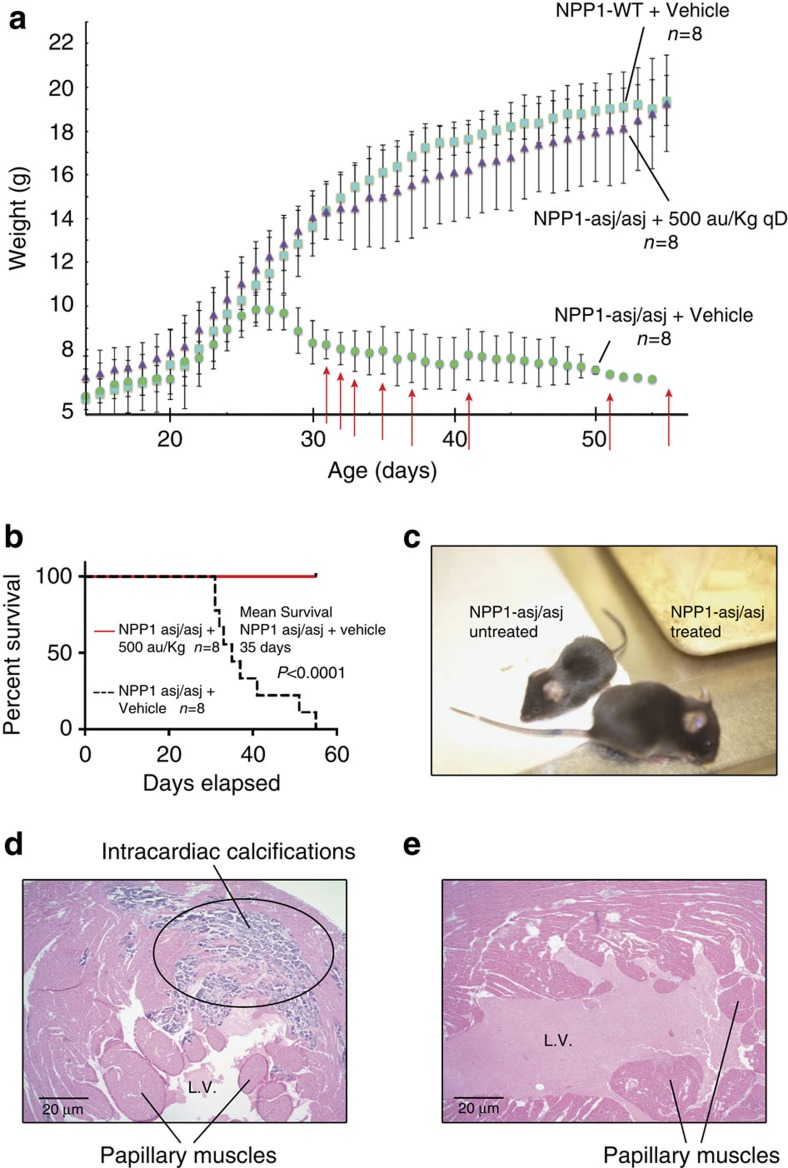
Figure 5
Figure 5. Proof of Concept Study.
(a) Daily animal weights. The mean daily weights of enpp1wt (cyan squares, n=8), treated enpp1asj/asj (purple triangles, n=8), and untreated enpp1asj/asj mice (green circles, n=8) are plotted with s.d.'s denoted by error bars. Dosing with eNPP1-Fc and weighing commenced on day 14. Treatment consisted of daily injections of 10 mg kg−1 ENPP1-Fc formulated in PBSplus and weekly injections of Gk 1.5. Untreated enpp1asj/asj and enpp1wt received daily injections of PBSplus and weekly injections of GK 1.5. Deaths in the untreated enpp1asj/asj cohort are denoted by red arrows on the day of death. No deaths were noted in the enpp1wt or the treated enpp1asj/asj cohort. (b) Survival curves, proof of concept study. The survival of treated and untreated enpp1asj/asj animals are plotted as a solid red line and dashed black line, respectively. Analysis by Log-rank (Mantle–Cox) test yields a χ2 of 13.18 and P value of 0.003. (c) Phenotypic comparison, treated and untreated enpp1asj/asj mice. There is a dramatic size difference in the treated and untreated animals, and a marked difference in the mobility and health of the animals, best seen in Supplementary Movie 1. (d) Left ventricle histology, untreated asj/asj mouse Hematoxylin and Eosin (H&E),displaying large focus of calcifications and micro-infarctions in the free wall. Scale bar, 20 μm. (e) Left ventricle histology, treated enpp1asj/asj mice (H&E). None of the treated enpp1asj/asj mice displayed abnormal L. ventricular histology. Scale bar, 20 μm.
Figure 6
Figure 6. Representative histology, proof of concept study.
(a,b) Aorta (Alizarin red). Untreated enpp1asj/asj mice displayed nearly circumferential aortic calcifications (a), while treated enpp1asj/asj mice did not (b). Scale bar, 20 μm. (c) Untreated enpp1asj/asj mice, right (R) ventricle Hematoxylin and Eosin (H&E). Two untreated enpp1asj/asj mice had large, confluent, myocardial infarctions in the free wall of the R. ventricle. Scale bar, 20 μm. All treated enpp1asj/asj mice displayed normal R. ventricle myocardium (not shown). (d) Untreated enpp1asj/asj mice, R. ventricle (H&E) higher power view of the boxed area in panel c. Scale bar, 10 μm. (e) Untreated enpp1asj/asj mice, R. ventricle (Trichrome) Trichrome stains of the R. ventricle in the same animal demonstrates the infarcted free wall. Scale bar, 20 μm. (f) Untreated enpp1asj/asj mice, myocardial septum (H&E). Nearly all animals (77%) displayed intracardiac calcifications surrounded by scar tissue, as demonstrated in this animal in the myocardial septum. Scale bar, 10 μm. (g) Untreated enpp1asj/asj mice, coronary arteries (H&E). All untreated enpp1asj/asj mice had coronary calcifications, with most displaying circumferential calcifications in coronary arteries surrounded by scar tissue, diagnostic of ischaemia and myocardial infarction. Scale bar, 10 μm. (h) Untreated enpp1asj/asj mice, coronary arteries (Trichrome). Trichrome stains of coronary artery regions of untreated enpp1asj/asj mice demonstrates increased fibrosis associated with vascular wall calcifications (blue colour and labelled ‘scar'), demonstrating the myocardial injury in the animals. Scale bar, 10 μm.
Figure 7
Figure 7. Biomarkers of disease response.
(a) Postmortem high-resolution micro-CT scans revealed extensive calcifications in untreated enpp1asj/asj mice in the hearts, coronary arteries, and ascending and descending aortas, but absolutely no calcifications in these organs in the treated enpp1asj/asj cohort or in enpp1wt mice. For further imaging, Supplementary Movie 2. (b) Plasma [PPi] in enpp1wt and treated and untreated enpp1asj/asj animals revealed that treatment with mENPP1-Fc increased [PPi] in enpp1asj/asj mice to WT levels, and well above the nearly undetectable levels present in untreated enpp1asj/asj mice. *P<0.0015, Students two-tailed t-test. (c,d) Per cent uptake of injected 99mPYP in heads of WT and asj/asj animals. The per cent uptake of 99mPYP in heads of animals in the natural history study were recorded weekly in the WT and asj/asj animals on the acceleration diet, demonstrating that 99mPYP uptake remains nearly constant over an 80 day period following birth, but differs markedly between the two experimental groups. (d) In the natural history study, the average 99mPYP uptake in heads of enpp1wt animals was around 15% of injected dose over the 80 day period, while the PYP uptake in enpp1asj/asj animals was around 20% *P<0.001, Students two-tailed t-test. (e,f) 99mPYP uptake. The per cent 99mPYP uptake in the heads of all experimental groups was recorded in the middle of the study (days 30–35, in e) and at the end of the study (days 50–65, in f). enpp1wt and treated enpp1asj/asj animals had per cent uptake in the skulls around 15%, while the untreated enpp1asj/asj cohort was at or above 20%. *P<0.001, Students two-tailed t-test.
Figure 8
Figure 8. Limited dosing study.
(a) To determine if calcifications reappear following cessation of dosing, two enpp1asj/asj animals were dosed daily with hENPP1-Fc between days 14–27 (green arrows), followed by daily dosing with PBSplus. Rejection of human version of ENPP1-Fc (hENPP1-Fc) was suppressed during the limited dosing period with weekly doses of GK 1.5. The average daily weights are of enpp1wt (blue triangles, n=10) and enpp1asj/asj (red squares, n=2) mice are plotted with the error bars denoting s.d.'s. The dosed enpp1asj/asj animals were followed for reappearance of vascular and organ calcifications by weekly in vivo CT scans. Calcifications in both animals were eventually observed (cyan arrows). One animal developed calcifications in the heart on day 64, which progressed to the aorta, liver, kidney and spleen by day 79. The second animal developed renal calcifications on day 79. (b) Negative control experiment. To demonstrate that ENPP1-Fc enzyme activity is essential for therapeutic effect, and that weekly GK 1.5 administration does not alter the natural history disease, enpp1asj/asj mice were dosed daily with 10 mg kg−1 inactive hENPP1-Fc, and weekly with GK 1.5 (blue diamonds, n=3). The average daily weights are plotted compared with enpp1asj/asj mice dosed with vehicle—daily PBSplus and weekly GK 1.5—(green triangles, n=9) and the error bars denote s.d.'s. All three enpp1asj/asj mice dosed with inactive ENPP1-Fc experienced a drop in weight and mortality (deaths denoted by blue arrows) similar to enpp1asj/asj mice dosed with vehicle (deaths denoted by red arrows), demonstrating that neither inactive ENPP1-Fc nor GK 1.5 extends survival.

References

    1. Moran J. J. Idiopathic arterial calcification of infancy: a clinicopathologic study. Pathol. Annu. 10, 393–417 (1975). - PubMed
    1. Rutsch F. et al.. Hypophosphatemia, hyperphosphaturia, and bisphosphonate treatment are associated with survival beyond infancy in generalized arterial calcification of infancy. Circ. Cardiovasc. Genet. 1, 133–140 (2008). - PMC - PubMed
    1. Otero J. E. et al.. Severe skeletal toxicity from protracted etidronate therapy for generalized arterial calcification of infancy. J. Bone Miner. Res. 28, 419–430 (2013). - PubMed
    1. Stuart G., Wren C. & Bain H. Idiopathic infantile arterial calcification in two siblings: failure of treatment with diphosphonate. Br. Heart J. 64, 156–159 (1990). - PMC - PubMed
    1. Stuart A. G. Idiopathic arterial calcification of infancy and pyrophosphate deficiency. J. Pediatr. 123, 170–171 (1993). - PubMed

Publication types

MeSH terms

Substances

Supplementary concepts