

Neoadjuvant Chemotherapy for Breast Cancer: Functional Tumor Volume by MR Imaging Predicts Recurrence-free Survival-Results from the ACRIN 6657/CALGB 150007 I-SPY 1 TRIAL
- PMID: 26624971
- PMCID: PMC4819899
- DOI: 10.1148/radiol.2015150013
Neoadjuvant Chemotherapy for Breast Cancer: Functional Tumor Volume by MR Imaging Predicts Recurrence-free Survival-Results from the ACRIN 6657/CALGB 150007 I-SPY 1 TRIAL
Abstract
Purpose: To evaluate volumetric magnetic resonance (MR) imaging for predicting recurrence-free survival (RFS) after neoadjuvant chemotherapy (NACT) of breast cancer and to consider its predictive performance relative to pathologic complete response (PCR).
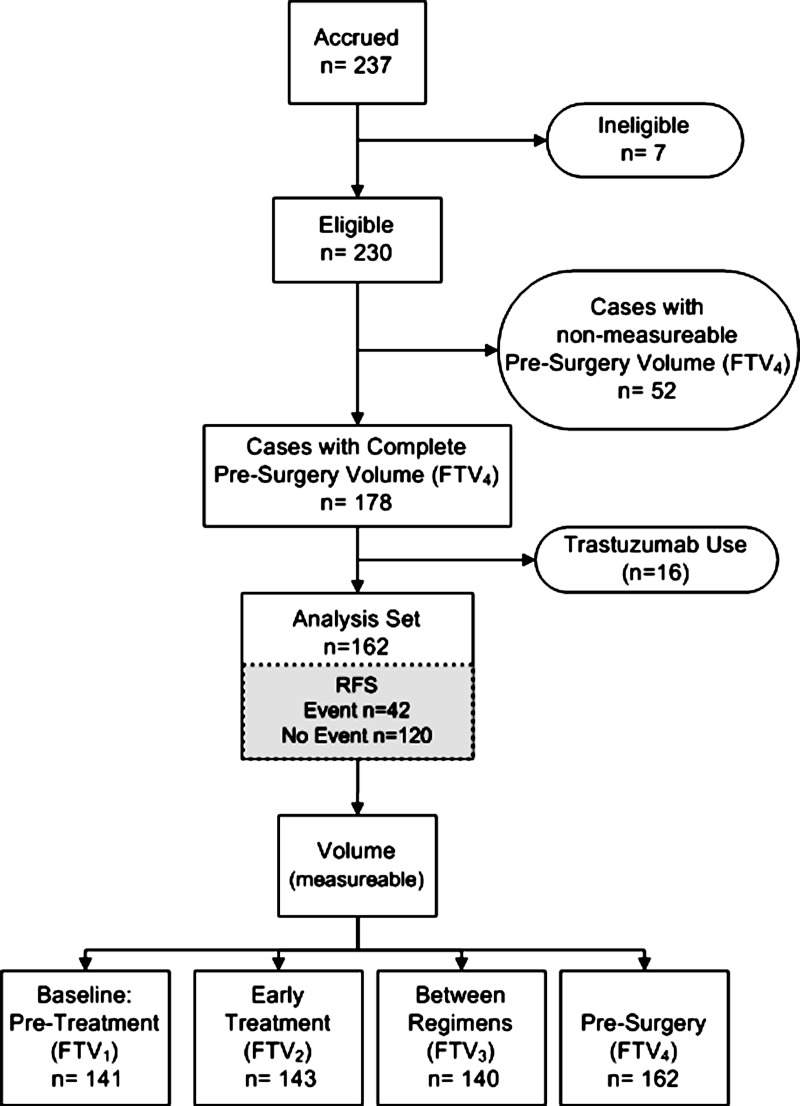
Materials and methods: This HIPAA-compliant prospective multicenter study was approved by institutional review boards with written informed consent. Women with breast tumors 3 cm or larger scheduled for NACT underwent dynamic contrast-enhanced MR imaging before treatment (examination 1), after one cycle (examination 2), midtherapy (examination 3), and before surgery (examination 4). Functional tumor volume (FTV), computed from MR images by using enhancement thresholds, and change from baseline (ΔFTV) were measured after one cycle and before surgery. Association of RFS with FTV was assessed by Cox regression and compared with association of RFS with PCR and residual cancer burden (RCB), while controlling for age, race, and hormone receptor (HR)/ human epidermal growth factor receptor type 2 (HER2) status. Predictive performance of models was evaluated by C statistics.
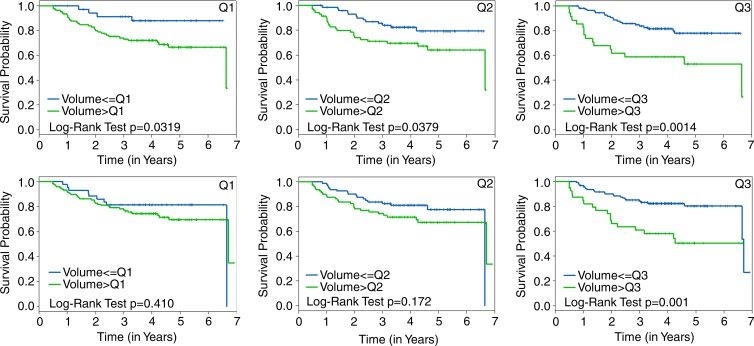
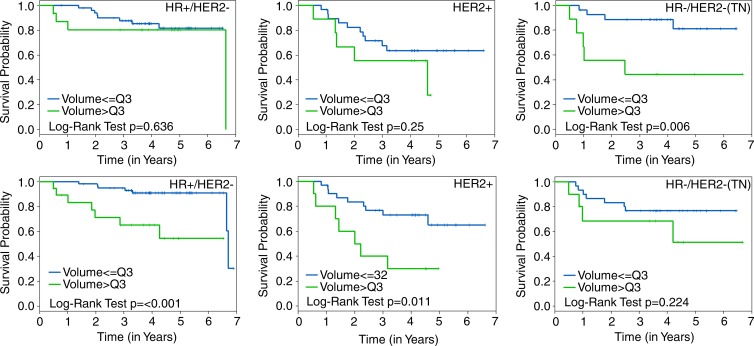
Results: Female patients (n = 162) with FTV and RFS were included. At univariate analysis, FTV2, FTV4, and ΔFTV4 had significant association with RFS, as did HR/HER2 status and RCB class. PCR approached significance at univariate analysis and was not significant at multivariate analysis. At univariate analysis, FTV2 and RCB class had the strongest predictive performance (C statistic = 0.67; 95% confidence interval [CI]: 0.58, 0.76), greater than for FTV4 (0.64; 95% CI: 0.53, 0.74) and PCR (0.57; 95% CI: 0.39, 0.74). At multivariate analysis, a model with FTV2, ΔFTV2, RCB class, HR/HER2 status, age, and race had the highest C statistic (0.72; 95% CI: 0.60, 0.84).
Conclusion: Breast tumor FTV measured by MR imaging is a strong predictor of RFS, even in the presence of PCR and RCB class. Models combining MR imaging, histopathology, and breast cancer subtype demonstrated the strongest predictive performance in this study.
Figures

References
-
- Croshaw R, Shapiro-Wright H, Svensson E, Erb K, Julian T. Accuracy of clinical examination, digital mammogram, ultrasound, and MRI in determining postneoadjuvant pathologic tumor response in operable breast cancer patients. Ann Surg Oncol 2011;18(11):3160–3163. - PubMed
-
- Londero V, Bazzocchi M, Del Frate C, et al. Locally advanced breast cancer: comparison of mammography, sonography and MR imaging in evaluation of residual disease in women receiving neoadjuvant chemotherapy. Eur Radiol 2004;14(8):1371–1379. - PubMed
-
- Yeh E, Slanetz P, Kopans DB, et al. Prospective comparison of mammography, sonography, and MRI in patients undergoing neoadjuvant chemotherapy for palpable breast cancer. AJR Am J Roentgenol 2005;184(3):868–877. - PubMed
-
- Akazawa K, Tamaki Y, Taguchi T, et al. Preoperative evaluation of residual tumor extent by three-dimensional magnetic resonance imaging in breast cancer patients treated with neoadjuvant chemotherapy. Breast J 2006;12(2):130–137. - PubMed
Publication types
MeSH terms
Grants and funding
- CA33601/CA/NCI NIH HHS/United States
- R01 CA116182/CA/NCI NIH HHS/United States
- U01 CA080098/CA/NCI NIH HHS/United States
- U10 CA033601/CA/NCI NIH HHS/United States
- U10 CA180821/CA/NCI NIH HHS/United States
- U10 CA079778/CA/NCI NIH HHS/United States
- P30 CA008748/CA/NCI NIH HHS/United States
- UG1 CA189828/CA/NCI NIH HHS/United States
- U01 CA079778/CA/NCI NIH HHS/United States
- CA079778/CA/NCI NIH HHS/United States
- R01 CA069587/CA/NCI NIH HHS/United States
- P30 CA016520/CA/NCI NIH HHS/United States
- U10 CA080098/CA/NCI NIH HHS/United States
- U10 CA180855/CA/NCI NIH HHS/United States
- U10 CA180820/CA/NCI NIH HHS/United States
- U10 CA180794/CA/NCI NIH HHS/United States
- U10 CA180867/CA/NCI NIH HHS/United States
- CA31964/CA/NCI NIH HHS/United States
- CA080098/CA/NCI NIH HHS/United States
LinkOut - more resources
Full Text Sources
Other Literature Sources
Medical
Research Materials
Miscellaneous
