. 2015 Dec 1;12(12):e1001909.
doi: 10.1371/journal.pmed.1001909. eCollection 2015 Dec.

Inequalities in Alcohol-Related Mortality in 17 European Countries: A Retrospective Analysis of Mortality Registers

Affiliations

Inequalities in Alcohol-Related Mortality in 17 European Countries: A Retrospective Analysis of Mortality Registers

Johan P Mackenbach et al. PLoS Med. .

Abstract

Background: Socioeconomic inequalities in alcohol-related mortality have been documented in several European countries, but it is unknown whether the magnitude of these inequalities differs between countries and whether these inequalities increase or decrease over time.

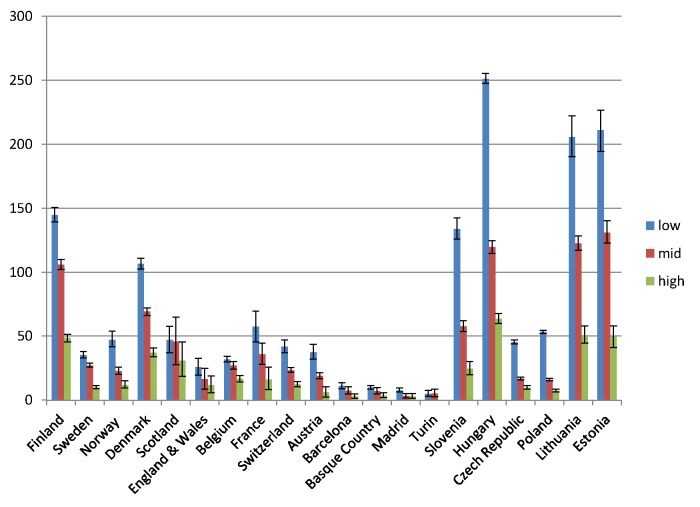
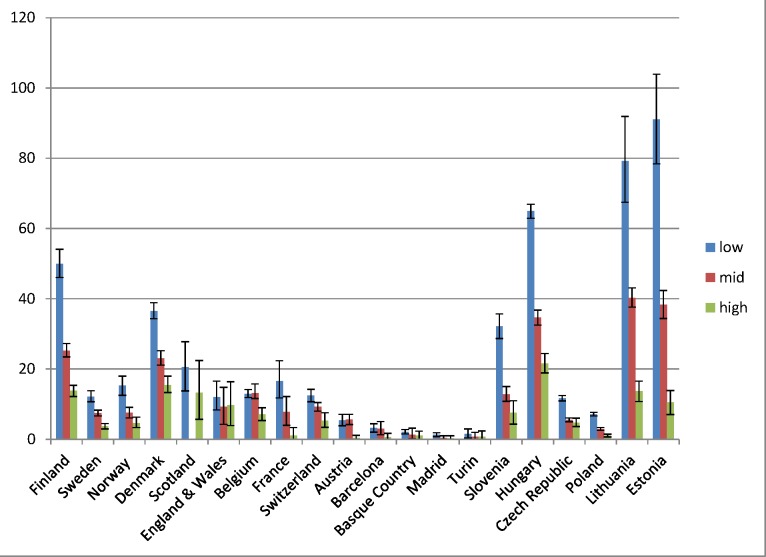
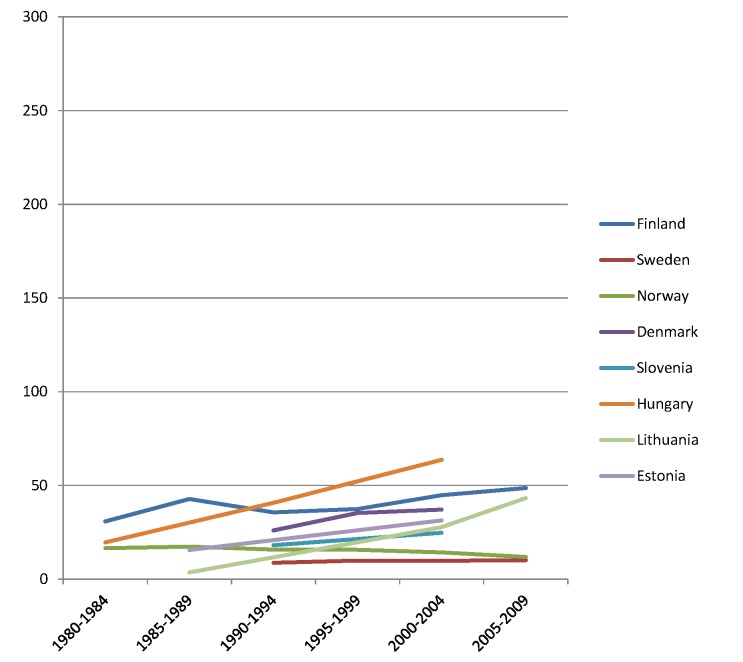
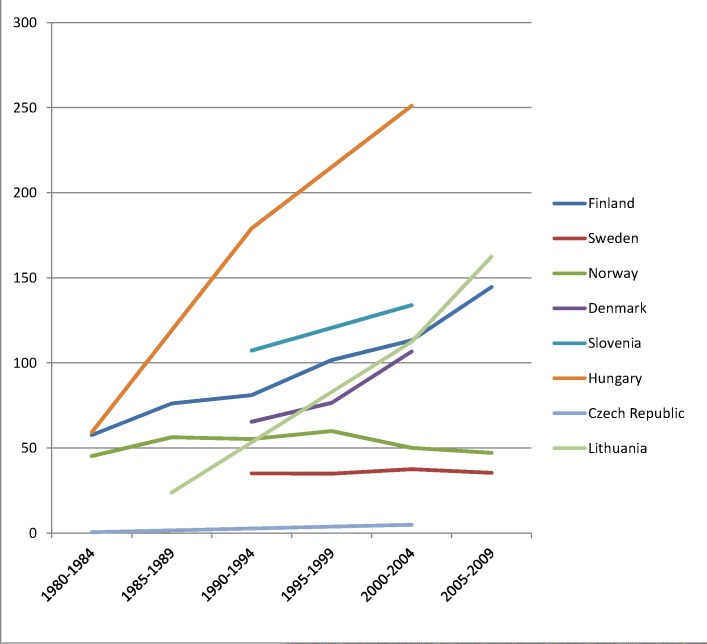
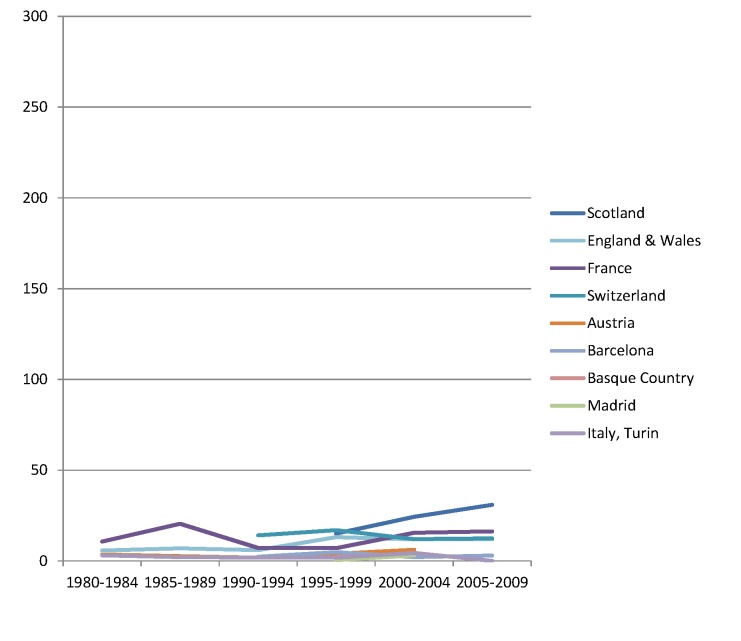
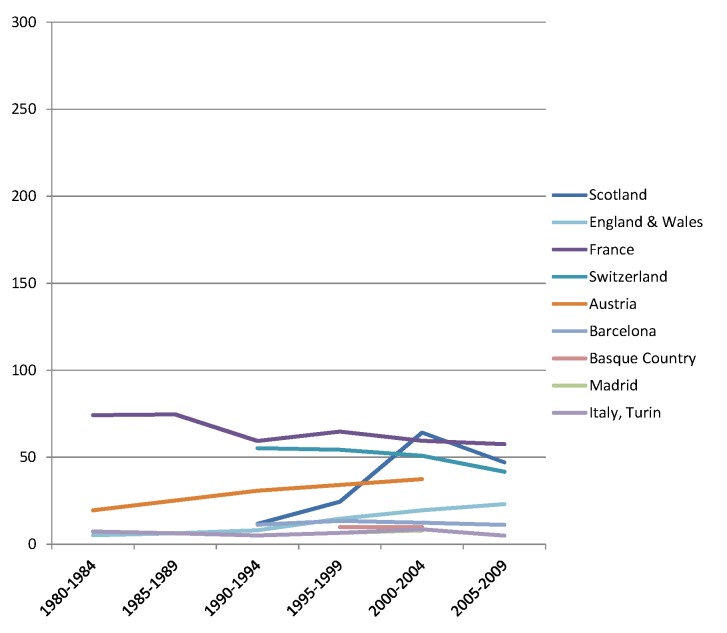
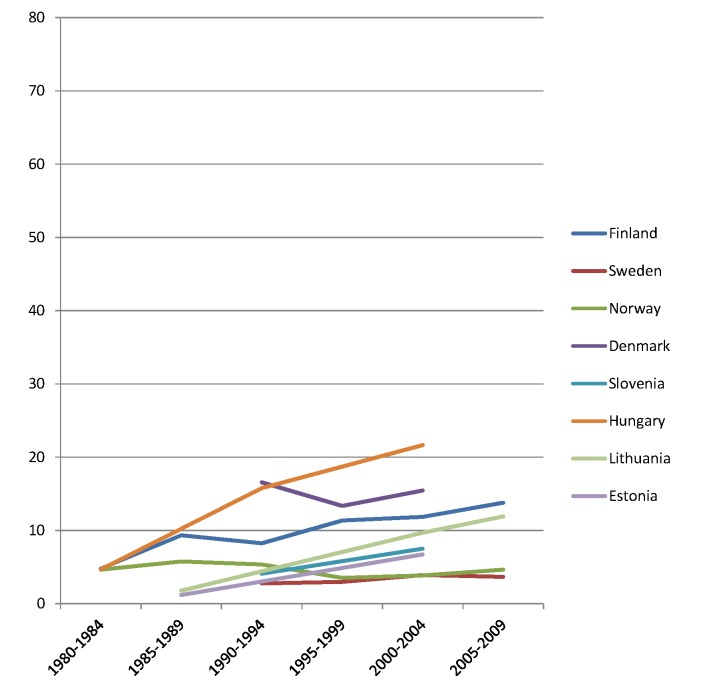
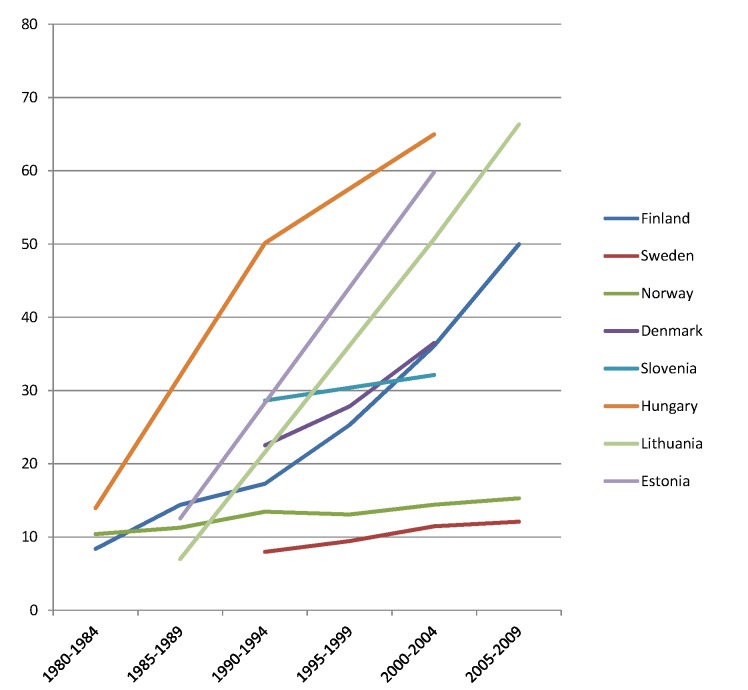
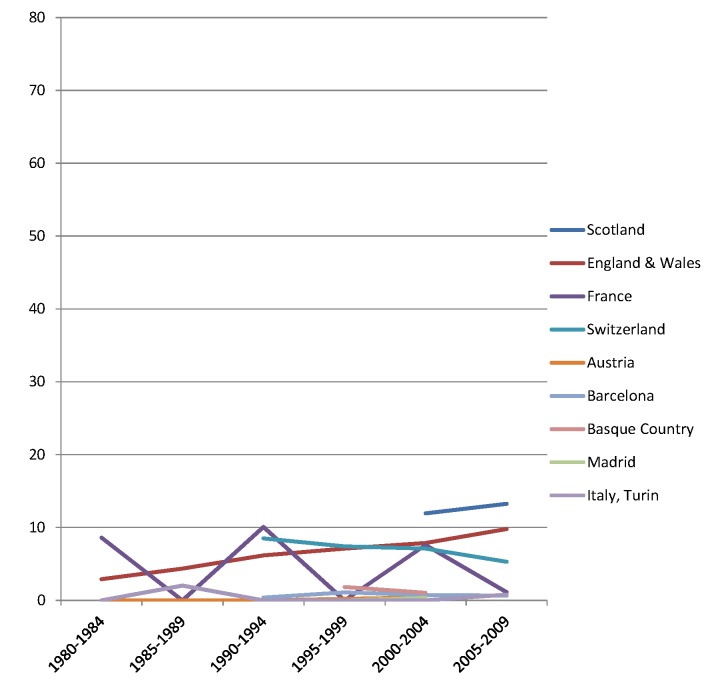
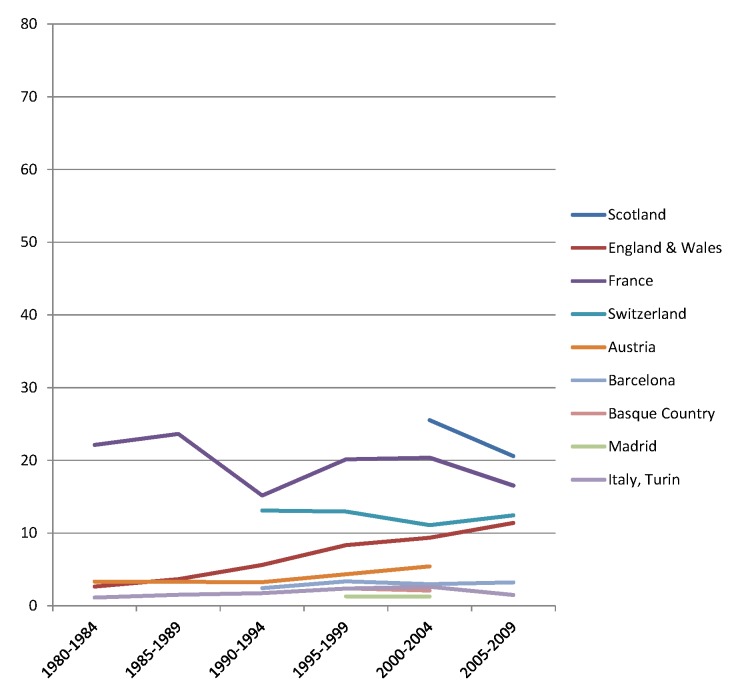
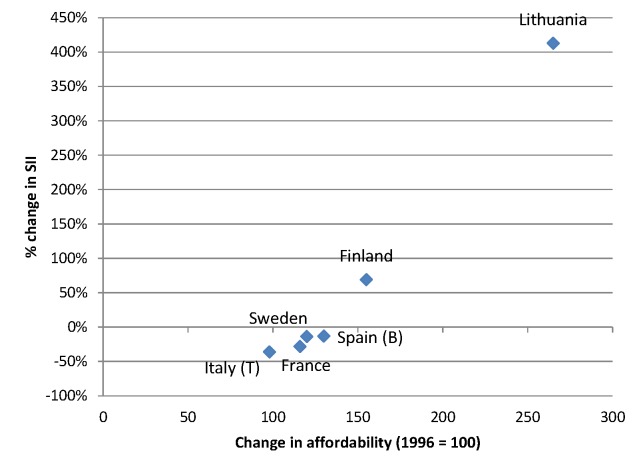
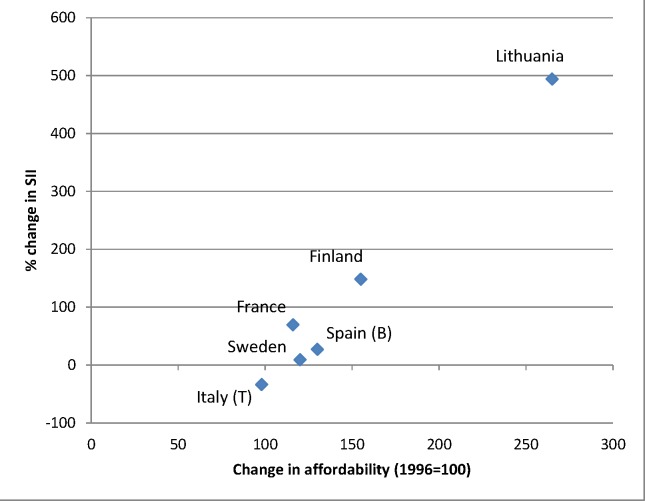
Methods and findings: We collected and harmonized data on mortality from four alcohol-related causes (alcoholic psychosis, dependence, and abuse; alcoholic cardiomyopathy; alcoholic liver cirrhosis; and accidental poisoning by alcohol) by age, sex, education level, and occupational class in 20 European populations from 17 different countries, both for a recent period and for previous points in time, using data from mortality registers. Mortality was age-standardized using the European Standard Population, and measures for both relative and absolute inequality between low and high socioeconomic groups (as measured by educational level and occupational class) were calculated. Rates of alcohol-related mortality are higher in lower educational and occupational groups in all countries. Both relative and absolute inequalities are largest in Eastern Europe, and Finland and Denmark also have very large absolute inequalities in alcohol-related mortality. For example, for educational inequality among Finnish men, the relative index of inequality is 3.6 (95% CI 3.3-4.0) and the slope index of inequality is 112.5 (95% CI 106.2-118.8) deaths per 100,000 person-years. Over time, the relative inequality in alcohol-related mortality has increased in many countries, but the main change is a strong rise of absolute inequality in several countries in Eastern Europe (Hungary, Lithuania, Estonia) and Northern Europe (Finland, Denmark) because of a rapid rise in alcohol-related mortality in lower socioeconomic groups. In some of these countries, alcohol-related causes now account for 10% or more of the socioeconomic inequality in total mortality. Because our study relies on routinely collected underlying causes of death, it is likely that our results underestimate the true extent of the problem.

Conclusions: Alcohol-related conditions play an important role in generating inequalities in total mortality in many European countries. Countering increases in alcohol-related mortality in lower socioeconomic groups is essential for reducing inequalities in mortality. Studies of why such increases have not occurred in countries like France, Switzerland, Spain, and Italy can help in developing evidence-based policies in other European countries.


Conflict of interest statement

The authors have declared that no competing interests exist.

Figures

Fig 1
Fig 1. Latest observed mortality from alcohol-related causes among men aged 35–79 y, by population and level of education.
The y-axis shows alcohol-related mortality, with 95% CIs, in deaths per 100,000 person-years.
Fig 2
Fig 2. Latest observed mortality from alcohol-related causes among women aged 35–79 y, by population and level of education.
The y-axis shows alcohol-related mortality, with 95% CIs, in deaths per 100,000 person-years. Among Scottish women in the middle education group, the number of deaths was smaller than ten, and because of confidentiality regulations, data could not be supplied for this group.
Fig 3
Fig 3. Trends in age-adjusted mortality from alcohol-related causes among men aged 35–79 y in the high education group in Northern and Eastern European countries, ca. 1980–2010, by country.
The y-axis shows age-adjusted alcohol-related mortality in deaths per 100,000 person-years.
Fig 4
Fig 4. Trends in age-adjusted mortality from alcohol-related causes among men aged 35–79 y in the low education group in Northern and Eastern European countries, ca. 1980–2010, by country.
The y-axis shows age-adjusted alcohol-related mortality in deaths per 100,000 person-years.
Fig 5
Fig 5. Trends in age-adjusted mortality from alcohol-related causes among men aged 35–79 y in the high education group in Western and Southern European countries/regions, ca. 1980–2010, by country/region.
The y-axis shows age-adjusted alcohol-related mortality in deaths per 100,000 person-years.
Fig 6
Fig 6. Trends in age-adjusted mortality from alcohol-related causes among men aged 35–79 y in the low education group in Western and Southern European countries/regions, ca. 1980–2010, by country/region.
The y-axis shows age-adjusted alcohol-related mortality in deaths per 100,000 person-years. In England and Wales, individuals in the low and middle education groups could not be distinguished before 2000, and therefore both groups have been combined in the low education group in all study periods.
Fig 7
Fig 7. Trends in age-adjusted mortality from alcohol-related causes among women aged 35–79 y in the high education group in Northern and Eastern European countries, ca. 1980–2010, by country.
The y-axis shows age-adjusted alcohol-related mortality in deaths per 100,000 person-years.
Fig 8
Fig 8. Trends in age-adjusted mortality from alcohol-related causes among women aged 35–79 y in the low education group in Northern and Eastern European countries, ca. 1980–2010, by country.
The y-axis shows age-adjusted alcohol-related mortality in deaths per 100,000 person-years.
Fig 9
Fig 9. Trends in age-adjusted mortality from alcohol-related causes among women aged 35–79 y in the high education group in Western and Southern European countries/regions, ca. 1980–2010, by country/region.
The y-axis shows age-adjusted alcohol-related mortality in deaths per 100,000 person-years.
Fig 10
Fig 10. Trends in age-adjusted mortality from alcohol-related causes among women aged 35–79 y in the low education group in Western and Southern European countries/regions, ca. 1980–2010, by country/region.
The y-axis shows age-adjusted alcohol-related mortality in deaths per 100,000 person-years. In England and Wales, individuals in the low and middle education groups could not be distinguished before 2000, and therefore both groups have been combined in the low education group in all study periods.
Fig 11
Fig 11. Change in alcohol affordability between 1996 and 2004 versus change in absolute inequality in alcohol-related mortality among men between ca. 1990–1994 and ca. 2005–2009.
Data on affordability are from Rabinovich et al. [59] and give levels of affordability relative to that observed in 1996. Only countries with both data on affordability and data on SII for ca. 1990–1994 and ca. 2005–2009 are included in this graph. A change in affordability >100 indicates that, as a result of increasing income and/or decreasing price, alcohol has become more affordable. B, Barcelona; T, Turin.
Fig 12
Fig 12. Change in alcohol affordability between 1996 and 2004 versus change in absolute inequality in alcohol-related mortality among women between ca. 1990–1994 and ca. 2005–2009.
Data on affordability are from Rabinovich et al. [59] and give levels of affordability relative to that observed in 1996. Only countries with both data on affordability and data on SII for ca. 1990–1994 and ca. 2005–2009 are included in this graph. A change in affordability >100 indicates that, as a result of increasing income and/or decreasing price, alcohol has become more affordable. B, Barcelona; T, Turin.

References

    1. Rehm J (2010) The risks associated with alcohol use and alcoholism. Alcohol Res Health 34: 135–143. - PMC - PubMed
    1. Rehm J, Baliunas D, Borges GL, Graham K, Irving H, et al. (2010) The relation between different dimensions of alcohol consumption and burden of disease: an overview. Addiction 105: 817–843. 10.1111/j.1360-0443.2010.02899.x - DOI - PMC - PubMed
    1. Bosetti C, Levi F, Lucchini F, Zatonski WA, Negri E, et al. (2007) Worldwide mortality from cirrhosis: an update to 2002. J Hepatol 46: 827–839. - PubMed
    1. Zatonski WA, Sulkowska U, Manczuk M, Rehm J, Boffetta P, et al. (2010) Liver cirrhosis mortality in Europe, with special attention to Central and Eastern Europe. Eur Addict Res 16: 193–201. 10.1159/000317248 - DOI - PubMed
    1. Leon DA, McCambridge J (2006) Liver cirrhosis mortality rates in Britain from 1950 to 2002: an analysis of routine data. Lancet 367: 52–56. - PubMed

Publication types