. 2015 Dec 1;10(12):e0143172.
doi: 10.1371/journal.pone.0143172. eCollection 2015.

A Rotational Cylindrical fMRI Phantom for Image Quality Control

Affiliations

A Rotational Cylindrical fMRI Phantom for Image Quality Control

David A Tovar et al. PLoS One. .

Abstract

Purpose: A novel phantom for image quality testing for functional magnetic resonance imaging (fMRI) scans is described.

Methods: The cylindrical, rotatable, ~4.5L phantom, with eight wedge-shaped compartments, is used to simulate rest and activated states. The compartments contain NiCl2 doped agar gel with alternating concentrations of agar (1.4%, 1.6%) to produce T1 and T2 values approximating brain grey matter. The Jacard index was used to compare the image distortions for echo planar imaging (EPI) and gradient recalled echo (GRE) scans. Contrast to noise ratio (CNR) was compared across the imaging volume for GRE and EPI.

Results: The mean T2 for the two agar concentrations were found to be 106.5±4.8, 94.5±4.7 ms, and T1 of 1500±40 and 1485±30 ms, respectively. The Jacard index for GRE was generally found to be higher than for EPI (0.95 versus 0.8). The CNR varied from 20 to 50 across the slices and echo times used for EPI scans, and from 20 to 40 across the slices for the GRE scans. The phantom provided a reproducible CNR over 25 days.

Conclusions: The phantom provides a quantifiable signal change over a head-size imaging volume with EPI and GRE sequences, which was used for image quality assessment.


Conflict of interest statement

Competing Interests: The authors have declared that no competing interests exist.

Figures

Fig 1
Fig 1. Front and Side view of the cylindrical phantom.
Top left: Front view of phantom/ Alternating Agar concentrations are labeled for the wedge compartments. Diameter dimensions of head phantom, which is inserted into a head coil are shown. Top right: Back view of phantom with handle. Handle turns 45 degrees clockwise and counter clockwise creating two “states” during fMRI experiments. Bottom: Side view of phantom. The lower base inserts and thus locks into patient table.
Fig 2
Fig 2. An example of 2D EPI image set obtained using the phantom.
TR/TE/FA = 4000ms/30ms/90°, matrix = 64x64, number of slices = 30, voxel size = 3.52mm x 3.52mm, slice thickness = 5 mm. The outer slices show distortion as evidenced by the curved partitions and signal loss due to the drop off in coil sensitivity.
Fig 3
Fig 3. Signal behavior within and across slices from TSE scan (TE = 154 ms).
For each slice, the mean value for the 1.4% agar compartment is slightly higher than that for the 1.6% agar concentration as expected. The signal behavior reflects the coil sensitivity as well as the phantom uniformity.
Fig 4
Fig 4. Plot of Jaccard index across slices.
The index values represents the relative warping of the various images compared to the rescaled center slice MPRAGE image. A value of 1 represents minimal deviation compared to the corresponding MPRAGE image. A) EPI TE = 21ms, B) EPI TE = 60 ms, C) EPI TE = 115ms, and D) GRE TE = 30ms. A significant drop off in the index is seen in the outer slices of the EPI images, which worsens with longer echo times as expected.
Fig 5
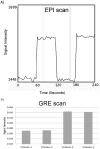
Fig 5. An example of temporal changes in signal for EPI and GRE.
Signal changes from a single voxel located in the 1.6% agar wedge, during a simulated fMRI block experiment: A) EPI run with 60 scans, TE = 60 ms, with phantom rotation after every 15 scans. B) GRE run with 4 scans, TE = 30 ms, with one phantom rotation after the 2nd scan.
Fig 6
Fig 6. CNR and CVCNR dependence on slice position for GRE scan.
A) CNRmean and B) CVcnr plotted across phantom slices for gradient echo scan (TR/TE/FA = 1880 ms/ 30 ms/70°, matrix = 128x128).
Fig 7
Fig 7. CNR and CVCNR dependence on slice position for EPI scans.
A) CNRmean and B) CVcnr plotted across phantom slices for EPI scans at various echo times (TR/TE/FA = 4000ms/21ms-115ms/90°, matrix = 64x64). There is a greater variation of CNR in EPI images compared to the GRE (Fig 6) across the slices and within the slices.

References

    1. Carlson T, Grol MJ, Verstraten FAJ. Dynamics of visual recognition revealed by fMRI. NeuroImage, 2006;32: 892–905 - PubMed
    1. Debener S, Ullsperger M, Siegel M, Engel A. Single-trial EEG-fMRI reveals the dynamics of cognitive function. TRENDS in Cognitive Sciences 2006;10(12): 558–562. - PubMed
    1. Ehrlich S, Yendiki A, Greve DN, Manoach DS, Ho BC, White T et al. Striatal function in relation to negative symptoms in schizophrenia. Psychological Medicine 2012;42: 267–282. 10.1017/S003329171100119X - DOI - PubMed
    1. Peters F, Collette F, Degueldre C, Sterpenich V, Majerus S, Salmon E. The neural correlates of verbal short-term memory in Alzheimer’s disease: an fMRI study. Brain 2009;132: 1833–1846. 10.1093/brain/awp075 - DOI - PubMed
    1. Baudrexel S, Witte T, Seifried C, von Wegner F, Beissner F, Klein JC, et al. Resting state fMRI reveals increased subthalamic nucleus—motor cortex connectivity in Parkinson's disease. NeuroImage, 2011;55: 1728–1738. 10.1016/j.neuroimage.2011.01.017 - DOI - PubMed