Comparative Study
. 2016 Jan 19;7(3):2629-45.
doi: 10.18632/oncotarget.6380.

Novel variants in MLL confer to bladder cancer recurrence identified by whole-exome sequencing

Affiliations
Comparative Study

Novel variants in MLL confer to bladder cancer recurrence identified by whole-exome sequencing

Song Wu et al. Oncotarget. .

Abstract

Bladder cancer (BC) is distinguished by high rate of recurrence after surgery, but the underlying mechanisms remain poorly understood. Here we performed the whole-exome sequencing of 37 BC individuals including 20 primary and 17 recurrent samples in which the primary and recurrent samples were not from the same patient. We uncovered that MLL, EP400, PRDM2, ANK3 and CHD5 exclusively altered in recurrent BCs. Specifically, the recurrent BCs and bladder cancer cells with MLL mutation displayed increased histone H3 tri-methyl K4 (H3K4me3) modification in tissue and cell levels and showed enhanced expression of GATA4 and ETS1 downstream. What's more, MLL mutated bladder cancer cells obtained with CRISPR/Cas9 showed increased ability of drug-resistance to epirubicin (a chemotherapy drug for bladder cancer) than wild type cells. Additionally, the BC patients with high expression of GATA4 and ETS1 significantly displayed shorter lifespan than patients with low expression. Our study provided an overview of the genetic basis of recrudescent bladder cancer and discovered that genetic alterations of MLL were involved in BC relapse. The increased modification of H3K4me3 and expression of GATA4 and ETS1 would be the promising targets for the diagnosis and therapy of relapsed bladder cancer.

Keywords: MLL; bladder cancer; drug-resistance; tumor recurrence; whole-exome sequencing.


Conflict of interest statement

CONFLICTS OF INTEREST

The authors declare no competing financial interests.

Figures

Figure 1
Figure 1. Frequently mutated genes identified in 37 bladder carcinomas
Significantly mutated genes are listed on the right. The upper histogram shows the somatic mutation rate in 20 primary tumors and 17 recurrent tumors. The heat map in central shows the distribution of mutations across all samples. All the mutations shown were confirmed by Sanger sequencing.
Figure 2
Figure 2. MLL, EP400 and PRDM2 exclusively alter in recurrent bladder carcinomas
A. Mutation frequencies are expressed as a percentage of 20 primary (grey) and 17 recurrent (pink) samples. The p-value generated by fisher exact test is marked over bars. B. Somatic mutations in genes from recurrent samples.
Figure 3
Figure 3. MLL mutation in recurrent bladder carcinomas enhance the occupancy of H3K4me3 in GATA4 and ETS1 promoters
A. Real-time PCR analysis of MLL, EP400 and PRDM2 between the non-mutated primary group and the mutated recurrent group (n = 20 for primary tumors, n = 4 for recurring tumors). Data is displayed as mean ± SD. B. Representative immuno- histochemical staining of MLL in B234 and B112. Overall staining for MLL was measured by multiplication of staining percentage (0%-100%) and staining intensity on a numerical scale (none = 1, weak = 2, moderate = 3, strong = 4), resulting in an overall product score. Scale bar = 50 μm. C. Real-time PCR analysis of MLL, GATA4, GATA6, MMP2, MMP13, ETS1 and HOXA9 between the primary group with wild type MLL (PT MLL WT) and the recurrent group with mutated MLL (RT MLL mut) (n = 20 for primary tumors, n = 4 for recurring tumors). Data is expressed as mean±SD. D. Western blot analysis of MLL, GATA4 and ETS1 between PT MLL WT and RT MLL mut. β-actin was used as loading control. E. CHIP assay was performed using H3K4me3 antibody and IgG antibody in B234 and B112. F. Kaplan-Meier curves displayed survival rates of bladder carcinomas patients with high vs low expression levels of GATA4 or ETS1. n, patient number. *P < 0.05; **P < 0.01.
Figure 4
Figure 4. Bladder cancer cells with MLL mutation display decreased susceptibility to epirubicin
A. Sanger sequencing of MLL PCR product in T24 WT and T24 Mut. B. Real-time PCR analysis of MLL, GATA4, and ETS1 mRNA levels in T24 WT and T24 Mut. Data is displayed as mean±SD. C. Western blot analysis of MLL, GATA4 and ETS1 in T24 WT and T24 Mut. β-actin was used as loading control. D. CHIP assay was performed using H3K4me3 antibody and IgG antibody in T24 WT and T24 Mut. E. Epirubicin was applied to induce apoptosis in T24 WT and T24 Mut and the cells were collected and analyzed at indicated point. Data is SSexpressed as mean±SD. F. The propagation curves of T24 WT and T24 Mut were measured by CCK8 with/without the treatment of epirubicin. Data is displayed as mean±SD. G. The cell cycle of T24 WT and T24 Mut were measured by PI staining with/without the treatment of epirubicin. Data is showed as mean±SD. *P < 0.05.
Figure 5
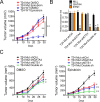
Figure 5. GATA4 and ETS1 participate in the drug-resistance of MLL mutated bladder cancer cells
A. Tumor formation assays of T24 WT and T24 Mut cells with DMSO or epirubicin. The volume of xenografts was measured every five days, V = (π/6)×abc. N = 5, data is displayed as mean ± SD. B. Real-time PCR analysis of GATA4 and ETS1 in T24 Mut shCtrl, T24 Mut shGATA4, T24 Mut shETS1 and T24 Mut Double sh. These results were repeated for three times. Data is displayed as mean ± S C. Subcutaneous tumor model T24 Mut shCtrl, T24 Mut shGATA4, T24 Mut shETS1 and T24 Mut Double sh with DMSO or epirubicin. Five days later, the mice were grouped and administered intraperitoneally with DMSO or epirubicin at a dose of 2 mg/kg two times per week for 30 days. The volume of xenografts was measured every five days. N = 5, data is displayed as mean ± SD. *P < 0.05; **P < 0.01.

References

    1. Cancer Genome Atlas Research N Comprehensive molecular characterization of urothelial bladder carcinoma. Nature. 2014;507(7492):315–322. - PMC - PubMed
    1. Chavan S, Bray F, Lortet-Tieulent J, Goodman M, Jemal A. International variations in bladder cancer incidence and mortality. Eur Urol. 2014;66(1):59–73. - PubMed
    1. Knowles MA, Hurst CD. Molecular biology of bladder cancer: new insights into pathogenesis and clinical diversity. Nat Rev Cancer. 2015;15(1):25–41. - PubMed
    1. Sylvester RJ, van der Meijden AP, Oosterlinck W, Witjes JA, Bouffioux C, Denis L, Newling DW, Kurth K. Predicting recurrence and progression in individual patients with stage Ta T1 bladder cancer using EORTC risk tables: a combined analysis of 2596 patients from seven EORTC trials. European urology. 2006;49(3):466–465. discussion 475-467. - PubMed
    1. Gui Y, Guo G, Huang Y, Hu X, Tang A, Gao S, Wu R, Chen C, Li X, Zhou L, He M, Li Z, Sun X, et al. Frequent mutations of chromatin remodeling genes in transitional cell carcinoma of the bladder. Nat Genet. 2011;43(9):875–878. - PMC - PubMed

Publication types

MeSH terms