. 2015 Dec 2:6:10066.
doi: 10.1038/ncomms10066.

Transformable liquid-metal nanomedicine

Affiliations

Transformable liquid-metal nanomedicine

Yue Lu et al. Nat Commun. .

Abstract

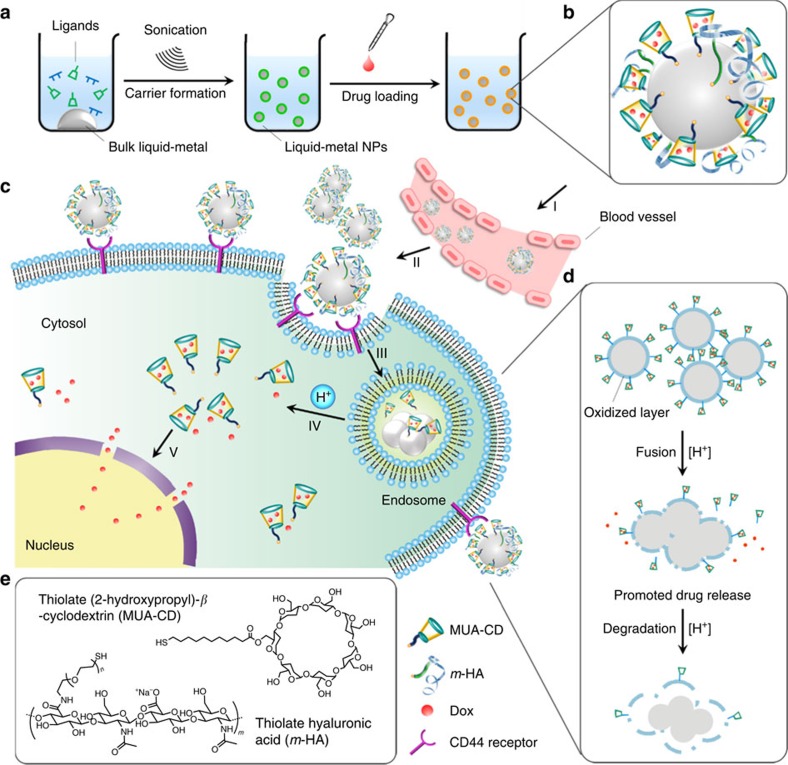
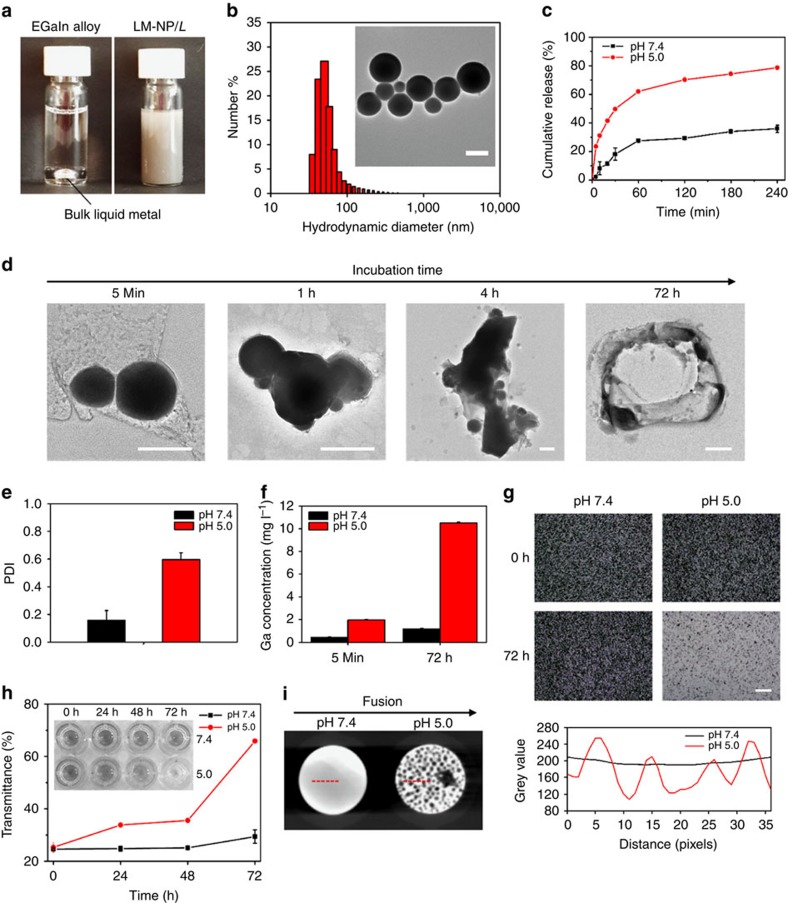
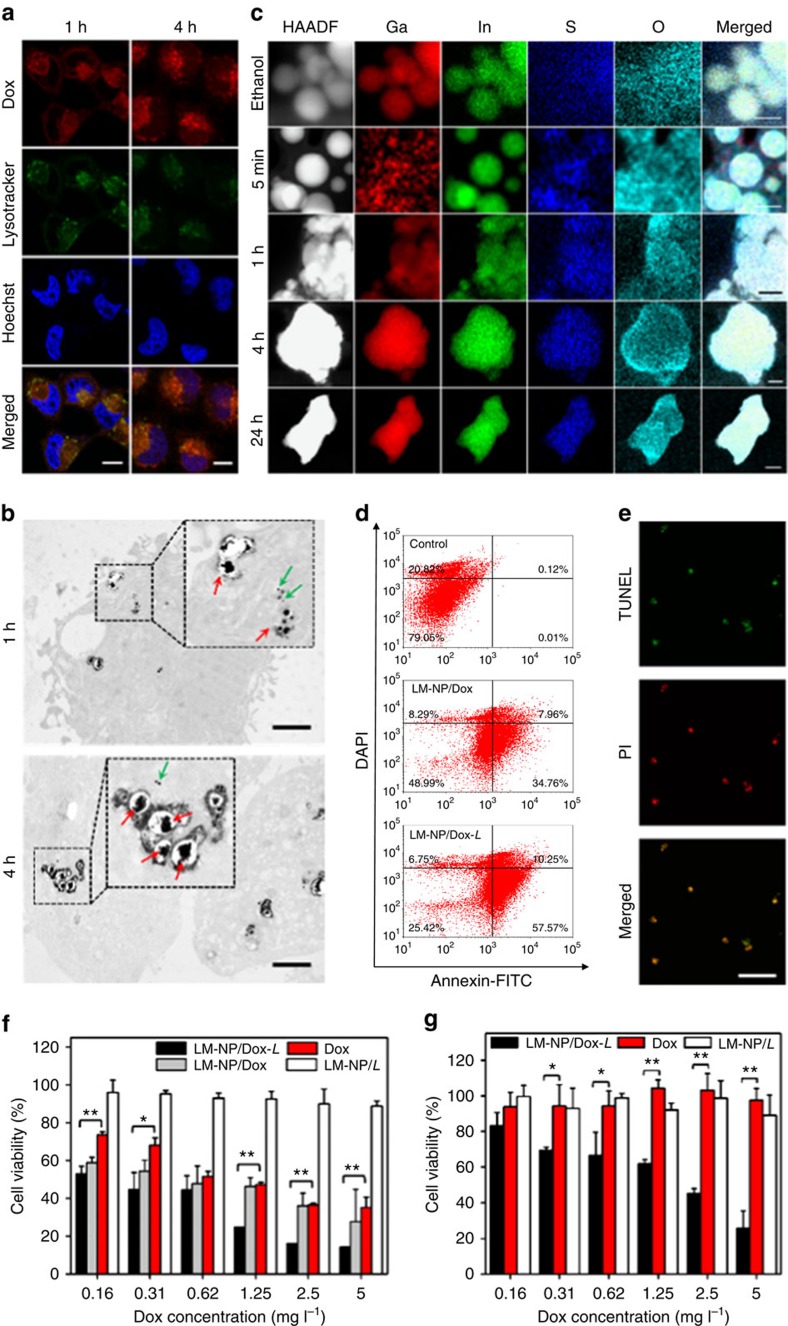
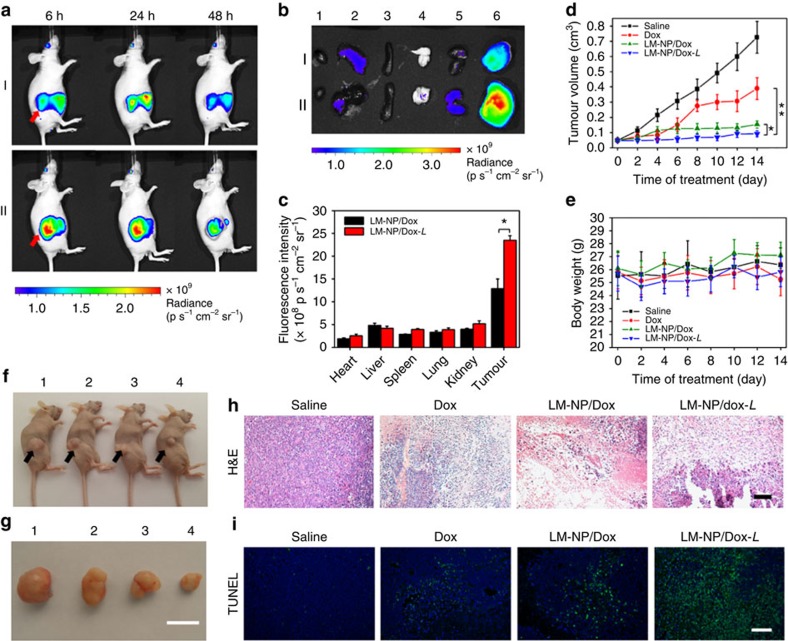
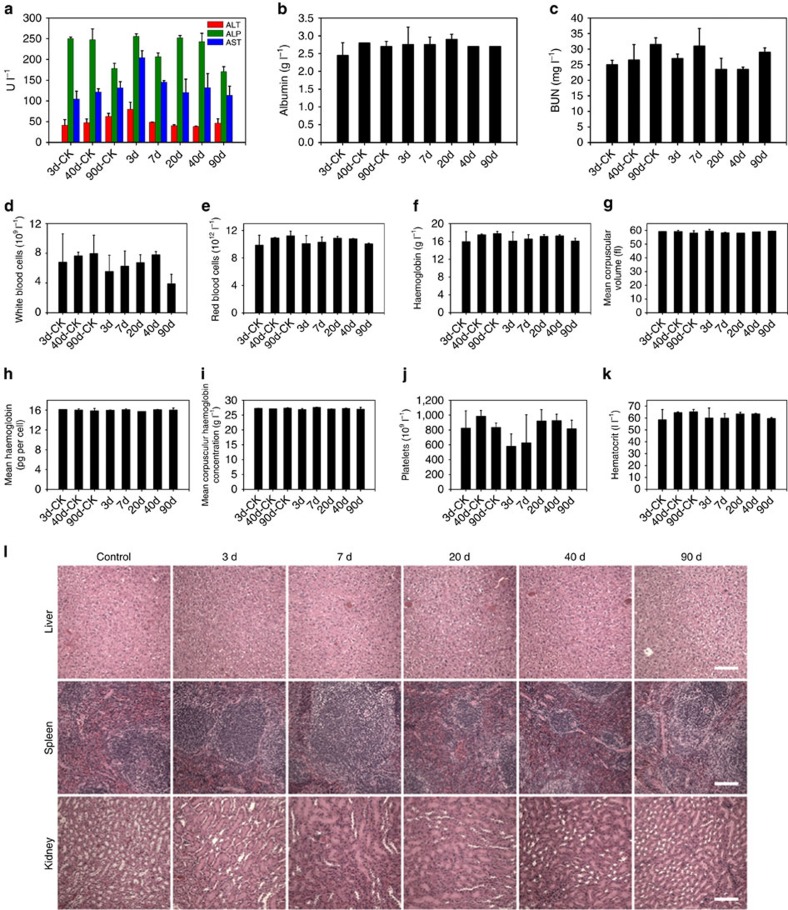
To date, numerous inorganic nanocarriers have been explored for drug delivery systems (DDSs). However, the clinical application of inorganic formulations has often been hindered by their toxicity and failure to biodegrade. We describe here a transformable liquid-metal nanomedicine, based on a core-shell nanosphere composed of a liquid-phase eutectic gallium-indium core and a thiolated polymeric shell. This formulation can be simply produced through a sonication-mediated method with bioconjugation flexibility. The resulting nanoparticles loaded with doxorubicin (Dox) have an average diameter of 107 nm and demonstrate the capability to fuse and subsequently degrade under a mildly acidic condition, which facilitates release of Dox in acidic endosomes after cellular internalization. Equipped with hyaluronic acid, a tumour-targeting ligand, this formulation displays enhanced chemotherapeutic inhibition towards the xenograft tumour-bearing mice. This liquid metal-based DDS with fusible and degradable behaviour under physiological conditions provides a new strategy for engineering theranostic agents with low toxicity.


Figures

Figure 1
Figure 1. Schematic design of the transformable liquid-metal delivery system.
(a) Preparation route of LM-NP/Dox-L. (b) The main components of LM-NP/Dox-L: thiolated CD with Dox, HA-based targeting motif and an EGaIn core. (c) pH-responsive delivery of Dox by LM-NP/Dox-L to the nuclei for the targeted cancer therapy. (I) accumulation of LM-NP/Dox-L at the tumour site through passive and active targeting; (II) specific binding to the overexpressed receptors on the tumour cells; (III) receptor-mediated endocytosis; (IV) acid-triggered fusion of LM-NP/Dox-L and endosomal/lysosomal escape of Dox-containing ligands; (V) accumulation of Dox in the nucleus. (d) Acid-triggered fusion and degradation process of LM-NP/Dox-L. (e) Chemical structures of MUA-CD and m-HA.
Figure 2
Figure 2. Characterization of liquid-metal nanospheres.
(a) EGaIn was ultrasonically dispersed in ligand containing ethanol mixture (shown schematically in Fig. 1a). (b) The hydrodynamic size of LM-NP/Dox-L measured by dynamic light scattering. Inset: TEM image of LM-NP/Dox-L. Scale bar, 100 nm. (c) The release profiles of LM-NP/Dox-L at different pH levels. (d) Representative TEM images of LM-NP/Dox-L after different time immersed in acidic (pH 5.0) PBS buffer. Scale bars, 100 nm (for 5 min); 100 nm (for 1 h); 100 nm (for 4 h); 400 nm (for 72 h). (e) Polydispersity index (PDI) of LM-NP/Dox-L immersed in neutral (pH 7.4) and acidic (pH 5.0) PBS buffer. (f) Changes of metal ion concentration under neutral and acidic environments. (g) Optical images of LM-NPs before and after acid treatment. Scale bar, 40 μm. (h) Light transmittance change over time. (i) X-ray images (left) of LM-NPs immersed in neutral (pH 7.4) and acidic (pH 5.0) PBS buffer (particles were imaged after 12 h treatment). The images were taken in a 96-well plate. Red lines indicate the areas quantitatively analysed. Grey value analysis (right) of representative area in X-ray images of LM-NPs. Error bars indicated s.d. (n=3).
Figure 3
Figure 3. Intracellular interaction and drug release.
(a) Intracellular delivery of LM-NP/Dox-L towards HeLa cells at different time points observed by confocal laser scanning microscopy. The cells were incubated with LM-NP/Dox-L at 37 °C for 1 and 4 h, respectively. The late endosomes and lysosomes were stained with LysoTracker Green, and the nuclei were stained with Hoechst 33342. Scale bar, 10 μm. (b) Representative TEM images of HeLa cells incubated with LM-NP/Dox-L for 1 and 4 h. Red arrows show fused nanospheres; green arrows show dispersion of single nanosphere in the cytosol. Scale bar, 2 μm. (c) Element mapping results of intracellular LM-NPs/Dox-L collected from HeLa cells after different incubation times. Scale bars, 100 nm (for 5 min); 100 nm (for 1 h); 100 nm (for 4 h); 200 nm (for 24 h). (d) Flow cytometric analysis of HeLa cell apoptosis induced by LM-NP/Dox-L for 12 h using the Annexin V-FITC/4,6-diamidino-2-phenylindole (DAPI) staining. (e) HeLa cell apoptosis induced by LM-NP/Dox-L for 20 h using the APO-BrdU TUNEL assay. (f) In vitro cytotoxicity of LM-NP/Dox and LM-NP/Dox-L on HeLa cells for 24 h. Error bars indicate s.d. (n=4). Note: the concentration of LM-NP/L is equal to the nanocarrier concentration of Dox-loaded formulations in each corresponding group; the error bars in f (group LM-NP/Dox-L at concentrations 1.25, 2.5 and 5 mg l−1) are small. (g) In vitro cytotoxicity of LM-NP/Dox-L on Dox-resistant HeLa cells for 24 h. Error bars indicate s.d. (n=4). Note: the concentration of LM-NP/L is equal to the nanocarrier concentration of Dox-loaded formulations in each corresponding group. *P<0.05, **P<0.01 compared with the Dox solution group (two-tailed Student's t-test).
Figure 4
Figure 4. Tumour targetability and antitumour activity.
(a) In vivo fluorescence imaging of the HeLa tumour-bearing nude mice at 6, 24 and 48 h after intravenous injection of Cy5.5-(LM-NP/Dox) (I) and Cy5.5-(LM-NP/Dox-L) (II) at Cy5.5 dose of 30 nmol kg−1. Arrows indicate the sites of tumours. (b) Ex vivo fluorescence imaging of the tumour and normal tissues collected from the HeLa tumour-bearing nude mice being killed at 48 h post injection. The numeric label for each organ is as follows: 1, heart; 2, liver; 3, spleen; 4, lung; 5, kidney; 6, tumour. (c) Region-of-interest analysis of fluorescent signals from the tumours and normal tissues. Error bars indicated s.d. (n=3). *P<0.05 (two-tailed Student's t-test). (d) The HeLa tumour growth curves after intravenous injection of different formulations of Dox at a dose of 2 mg kg−1. Error bars indicate s.d. (n=5). *P<0.05, **P<0.01 (two-tailed Student's t-test). (e) The body weight variation of HeLa tumour-bearing mice during treatment. Error bars indicate s.d. (n=5). (f) Representative images of the HeLa xenograft tumours of the mice after treatment with the studied Dox formulations at day 14. The numeric label for each mouse is as follows: 1, saline; 2, Dox; 3, LM-NP/Dox; 4, LM-NP/Dox-L. Arrows indicate the sites of tumours. (g) Representative images of HeLa xenograft tumours collected from the mice after treatment with different formulations at day 14. The numeric label for each tumour is as follows: 1, saline; 2, Dox; 3, LM-NP/Dox; 4, LM-NP/Dox-L. Scale bar, 1 cm. (h) Histological observation of the tumour tissues after treatment. The tumour sections were stained with haematoxylin and eosin (H&E). Scale bar, 100 μm. (i) Detection of apoptosis in the tumour tissues after treatment. The tumour sections were stained with fluorescein-dUTP (green) for apoptosis and Hoechst for the nuclei (blue). Scale bar, 50 μm.
Figure 5
Figure 5. Toxicology evaluation.
Blood biochemistry and haematology data of female Balb/c mice treated with LM-NPs/L at the dose of 45 mg kg−1 (total nanocarrier dose used in antitumuor efficacy study) at 3, 7, 20, 40 and 90 d: (a) alanine aminotransferase (ALT), alkaline phosphatase (ALP) and aspartate aminotransferase (AST) levels in the blood at different time points after LM-NPs/L treatment. (b,c) Time-course changes of albumin concentration and blood urea nitrogen (BUN). (d-k) Time-course changes of white blood cells (d), red blood cells (e), platelets (f), haemoglobin (g), mean corpuscular volume (h), mean corpuscular haemoglobin (i), mean corpuscular haemoglobin concentration (j) and haematocrit (k) from control mice (CK) and LM-NPs/L-treated mice. Error bars indicate s.d. (n=3). (l) Histology evaluation of the major organs (liver, spleen and kidney) collected from the control untreated mice and LM-NPs/L-injected mice at different time points post injection. Scale bars, 100 μm. d, days.

References

    1. Liong M. et al. Multifunctional inorganic nanoparticles for imaging, targeting, and drug delivery. ACS Nano 2, 889–896 (2008). - PMC - PubMed
    1. Huang H.-C., Barua S., Sharma G., Dey S. K. & Rege K. Inorganic nanoparticles for cancer imaging and therapy. J. Control. Release 155, 344–357 (2011). - PubMed
    1. Langille M. R., Personick M. L., Zhang J. & Mirkin C. A. Defining rules for the shape evolution of gold nanoparticles. J. Am. Chem. Soc. 134, 14542–14554 (2012). - PubMed
    1. Sun T. et al. Engineered nanoparticles for drug delivery in cancer therapy. Angew. Chem. Int. Ed. Engl. 53, 12320–12364 (2014). - PubMed
    1. Tian B. et al. Three-dimensional, flexible nanoscale field-effect transistors as localized bioprobes. Science 329, 830–834 (2010). - PMC - PubMed

Publication types

MeSH terms