. 2016 May 15:101:113-24.
doi: 10.1016/j.ymeth.2015.11.019. Epub 2015 Nov 25.

Rapid Ngn2-induction of excitatory neurons from hiPSC-derived neural progenitor cells

Affiliations

Rapid Ngn2-induction of excitatory neurons from hiPSC-derived neural progenitor cells

Seok-Man Ho et al. Methods. .

Abstract

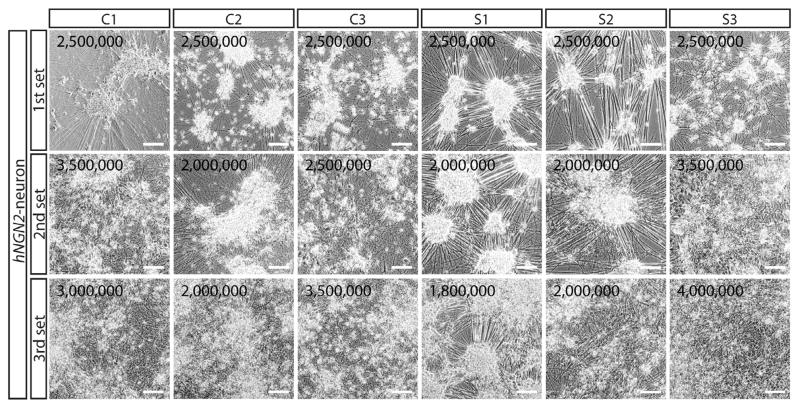
Since the discovery of somatic reprogramming, human induced pluripotent stem cells (hiPSCs) have been exploited to model a variety of neurological and psychiatric disorders. Because hiPSCs represent an almost limitless source of patient-derived neurons that retain the genetic variations thought to contribute to disease etiology, they have been heralded as a patient-specific platform for high throughput drug screening. However, the utility of current protocols for generating neurons from hiPSCs remains limited by protracted differentiation timelines and heterogeneity of the neuronal phenotypes produced. Neuronal induction via the forced expression of exogenous transcription factors rapidly induces defined populations of functional neurons from fibroblasts and hiPSCs. Here, we describe an adapted protocol that accelerates maturation of functional excitatory neurons from hiPSC-derived neural progenitor cells (NPCs) via lentiviral transduction of Neurogenin 2 (using both mNgn2 and hNGN2). This methodology, relying upon a robust and scalable starting population of hiPSC NPCs, should be readily amenable to scaling for hiPSC-based high-throughput drug screening.

Keywords: Directed differentiation; Modeling neuropsychiatric disease; Neuronal induction; hiPSC; iNeuron.


Conflict of interest statement

Author information

The authors have declared that no competing interests exist.

Figures

Fig. 1
Fig. 1
Scheme of Ngn2-neuronal induction from human NPCs and the accelerated neuronal morphology of Ngn2-NPCs. (A) Schematic of mNgn2 and hNGN2 neuronal induction, starting from hiPSC-derived NPCs. (B) Representative bright-field images of hiPSCs, NPCs and mNgn2-induced neurons. Scale bar 100 μm. (C) Timeline of mNgn2 and hNGN2-neuronal induction strategy. (D) GFP images of NPCs transduced with GFP-PuroR lentivirus (images taken before and 24 h after doxycycline treatment). Scale bar 100 μm. (E) FACS quantification of the percentage of GFP-positive cells across ten NPC lines transduced with hNGN2-eGFP-PuroR (presented as the average of three NPC lines each from two controls, and one NPC line each from a third control as well as three schizophrenia patients). (F) GFP images of live GFP-, mNgn2- and hNGN2-transduced NPCs at various induction time points, showing that Ngn2-NPCs acquire neuronal morphology faster than GFP-NPCs. Scale bar 50 μm. (G) Averaged MAP2AB fluorescent intensity of GFP-, mNgn2 and hNGN2-induced neurons at three weeks induction. Error bars are SEM (Standard Error of the Mean). *p < 0.05, **p < 0.01, ***p < 0.001.
Fig. 2
Fig. 2
Accelerated increase in MAP2AB protein and RNA by Ngn2-transduction. (A) Representative images of mNgn2-induced neurons and GFP-NPCs at two weeks immunostained with neuronal dendrite marker MAP2AB (red), GFP (green) and DAPI-stained nuclei (blue). Scale bar 30 μm. (B) Averaged MAP2AB fluorescent intensity of GFP-NPCs and mNgn2-induced neurons at two weeks induction. MAP2AB intensity was normalized to total DAPI-positive nuclei per image, and further standardized to GFP-NPCs; mNgn2-induced neurons showed a 1.3-fold increase in MAP2AB intensity over GFP-NPCs. (C) Real-time qPCR analysis of MAP2AB mRNA expression from GFP-NPCs and mNgn2-induced neurons at two weeks of age. The expression level is normalized to GAPDH, and further standardized to GFP-NPCs; mNgn2-neurons showed 2.4-fold increase in MAP2AB. (D) Representative images of two-week-old and three-week-old mNgn2-induced neurons stained with MAP2AB (red) and DAPI (blue). Scale bar 30 μm. (E) Averaged MAP2AB fluorescent intensity of two-week-old and three-week-old mNgn2-induced neurons, normalized to two-week-old mNgn2-induced neurons; there was a 1.35-fold increased MAP2AB intensity in three-week-old mNgn2-induced neurons. Error bars are SEM (Standard Error of the Mean). *p < 0.05, **p < 0.01, ***p < 0.001.
Fig. 3
Fig. 3
Evoked activity recorded from Ngn2-induced neurons. (A) Voltage clamp recording shows putative voltage-gated Na+ (inward) and K+ (outward) currents. Voltage pulses shown below (−100 to +70 mV). Holding potential was −70 mV. (B) Current clamp recording from the same neuron shows evoked action potentials. Dashed line indicates −60 mV. Current injection pulses shown below (−16 pA to 48 pA).
Fig. 4
Fig. 4
Accelerated synaptic differentiation of Ngn2-induced neurons by neuronal induction. (A) Representative images of mNgn2-neurons and GFP-NPCs at three weeks, immunostained with presynaptic marker SYN1 (red) and MAP2AB (magenta). Scale bar 4 μm. (B) SYN1 puncta count, normalized to MAP2AB+ area, of mNgn2-induced neurons and GFP-NPCs at three weeks (gradual doxycycline withdrawal from day 2). The SYN1 puncta ratio was increased 1.9-fold relative to matched GFP-NPCs. (C) Real-time qPCR analysis of SYN1, vGLUT1, vGLUT2 and PSD95 mRNA expression from GFP-NPCs and mNgn2-induced neurons at three weeks, normalized to GAPDH, relative to GFP-NPCs. mNgn2-neurons showed increased SYN1 (2.3-fold), vGLUT1 (4.5-fold), vGLUT2 (3.8-fold); there no significant difference in PSD95 expression. (D) qPCR analysis of TH, GAD67, vGAT, TPH1, GFAP and S100β mRNA expression between three-week-old mNgn2-induced neurons and 6-week-old hiPSC forebrain (FB) neurons derived by directed differentiation; Ngn2-induced neurons showed decreased TH (6.3-fold), GAD67 (1.5-fold), comparably low levels of vGAT and TPH1, and decreased GFAP (13.6-fold) and S100β(3.2-fold) expression relative to 6-week-old forebrain neurons. (E) Representative images of 3-week-old mNgn2-induced neurons and PuroR-NPCs, stained with the dopaminergic marker TH, the GABAergic marker GAD65/67 and the astrocyte marker GFAP. DAPI-stained nuclei (blue). Scale bar 30 μm. (F) Representative bright-field images of 3-week-old hNGN2-induced neurons treated with 0 M, 10 nM, 50 nM, 100 nM and 1 μM Ara-C from days 6–20. Scale bar 30 μm. (G) Representative images of 3-week–old hNGN2-induced neurons (from two independent controls) treated with 0 nM, 10 nM, 50 nM, and 100 nM Ara-C from days 6–20, stained with the replication marker Ki67. DAPI-stained nuclei (blue). Scale bar 30 μm. (H) Percentage of Ki67-positive cells in three-week-old Ngn2-induced neuron populations treated with between 0 and 100 nM Ara-C. Error bars are SEM. *p < 0.05, **p < 0.01, ***p < 0.001.
Fig. 5
Fig. 5
Transient Ngn2 is sufficient to generate induced neurons. (A) Timeline of mNgn2-neuronal induction strategy with different doxycycline lengths. Doxycycline was withdrawn at day two (D2), day eight (D8), day fourteen (D14) or not at all (No W/D). (B) Representative images of three-week-old mNgn2-induced neurons immunostained with MAP2AB (red) and DAPI (blue). Scale bar 30 μm. (C) Average MAP2AB fluorescent intensity at three weeks. (D) Representative images mNgn2-induced neurons immunostained with the presynaptic marker SYN1 (red) and MAP2AB (magenta). Scale bar 4 μm. (E) SYN1 puncta count, normalized to MAP2AB+ area at three-weeks. (F) Real-time qPCR analysis of SYN1, vGLUT1, vGLUT2 and PSD95 mRNA expression at three-weeks. Error bars are SEM. *p < 0.05, **p < 0.01, ***p < 0.001.
Fig. 6
Fig. 6
Electrical activity of Ngn2-induced neurons from NPCs. (A) 5-min MEA raster plot of spontaneous activity from a neural network of 14-day-old neurons, with 0-days (left panel) or 14-days (right panel) doxycycline treatment to induce mNgn2 expression. The response over multiple electrodes is a measurement of network connectivity. Each thin black line is representative of an action potential. Bursts of electrical activity are indicated with solid blue blocks. (B) The percentage of active electrodes per well (left panel) or percentage of spikes in bursts (right panel) following either 0 days (white bar), 2 days (pink bar), 8 days (light red) or 14 days (dark red) of doxycycline treatment to induce mNgn2 expression in 14-day-old neurons. (C) Total number of spikes (left panel) or mean firing rate (Hz) (right panel) following treatment with vehicle control (DMSO), picrotoxin (PTX), 6-cyano-7-nitroquinoxaline-2,3-dion (CNQX) and tetrodotoxin (TTX) on 21-day-old hNGN2-neurons. Error bars are SEM. *p < 0.05, **p < 0.01, ***p < 0.001.
Fig. 7
Fig. 7
Inter-individual efficiencies in Ngn2-induction between NPC lines. Representative bright-field images of hNGN2-neurons from six individuals (three controls and three schizophrenia patients) over three independent experiments. Varying the initial seeding density of individual NPC lines (NPC plating densities inset) is required if achieving a consistent neuronal density at the end-point is desired.

References

    1. Molyneaux BJ, Arlotta P, Menezes JR, Macklis JD. Neuronal subtype specification in the cerebral cortex. Nat Rev Neurosci. 2007;8:427–437. - PubMed
    1. Kamiya A, et al. A schizophrenia-associated mutation of DISC1 perturbs cerebral cortex development. Nat Cell Biol. 2005;7:1167–1178. - PubMed
    1. Kvajo M, et al. A mutation in mouse Disc1 that models a schizophrenia risk allele leads to specific alterations in neuronal architecture and cognition. Proc Natl Acad Sci USA. 2008;105:7076–7081. - PMC - PubMed
    1. Black JE, et al. Pathology of layer V pyramidal neurons in the prefrontal cortex of patients with schizophrenia. Am J Psychiatry. 2004;161:742–744. - PubMed
    1. Glantz LA, Lewis DA. Decreased dendritic spine density on prefrontal cortical pyramidal neurons in schizophrenia. Arch Gen Psychiatry. 2000;57:65–73. - PubMed

Publication types

MeSH terms

Substances