. 2016 Jan 12;23(1):143-54.
doi: 10.1016/j.cmet.2015.10.014. Epub 2015 Nov 25.

Peripheral Circadian Clocks Mediate Dietary Restriction-Dependent Changes in Lifespan and Fat Metabolism in Drosophila

Affiliations

Peripheral Circadian Clocks Mediate Dietary Restriction-Dependent Changes in Lifespan and Fat Metabolism in Drosophila

Subhash D Katewa et al. Cell Metab. .

Abstract

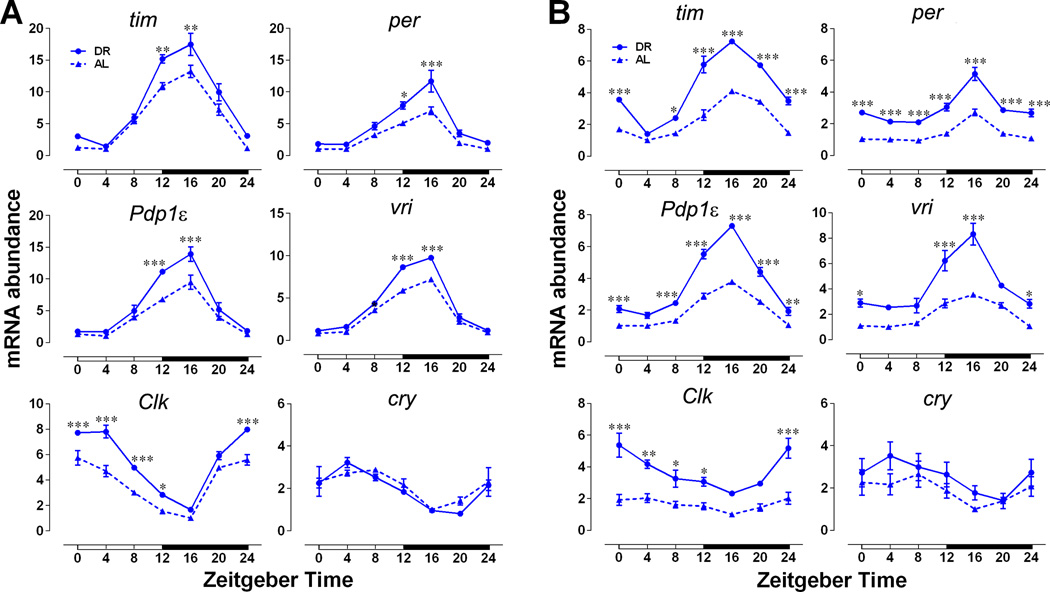
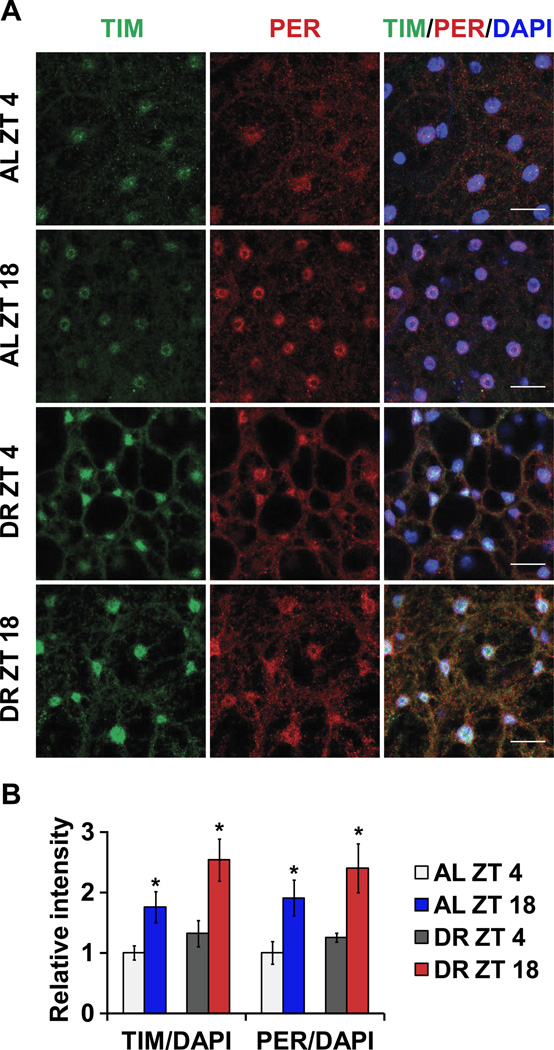
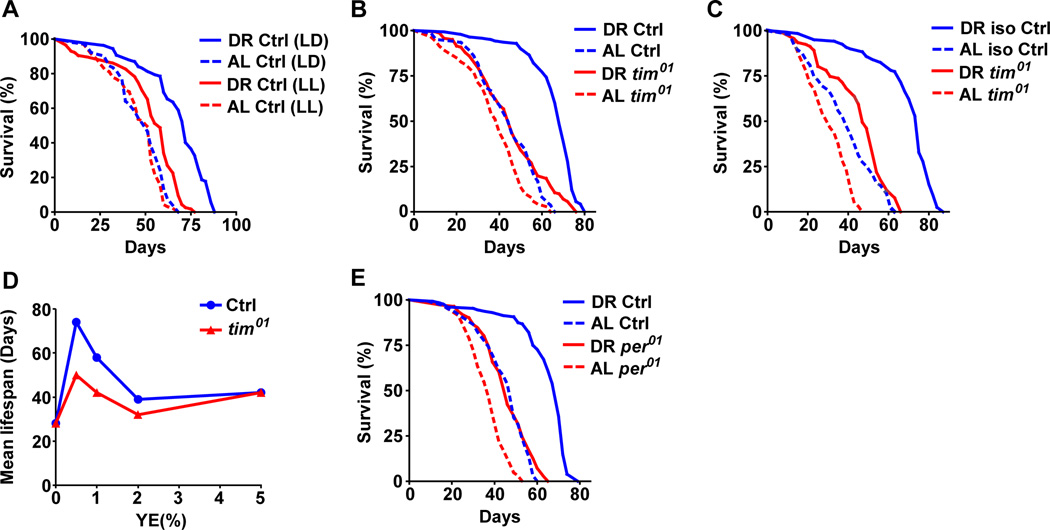
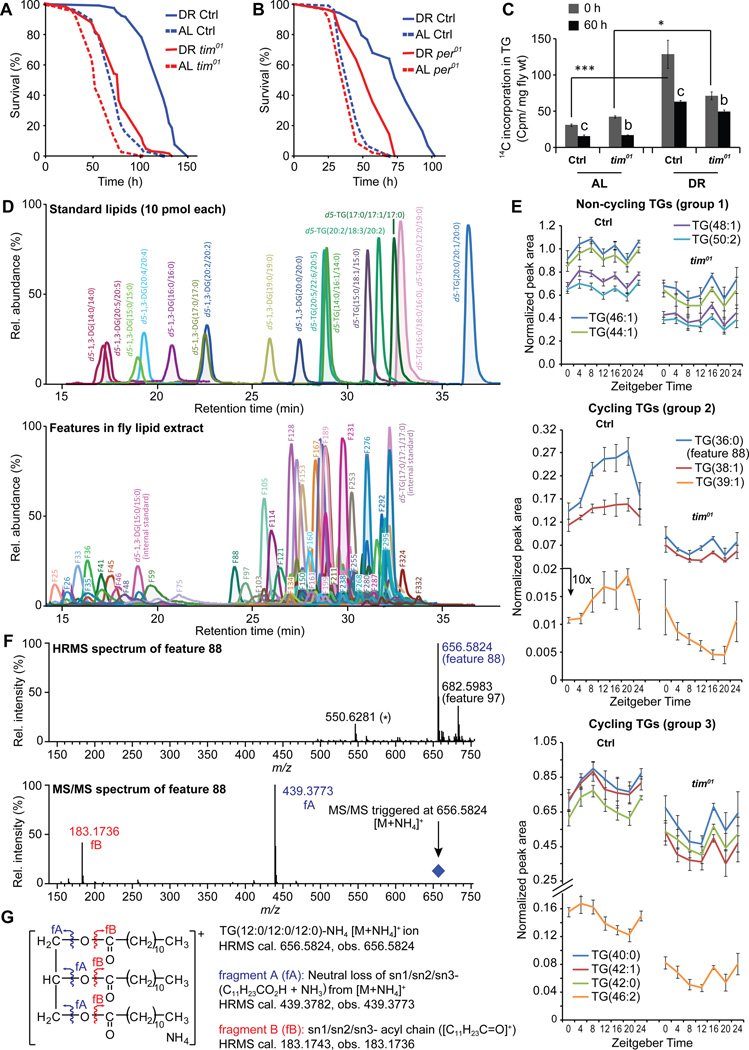
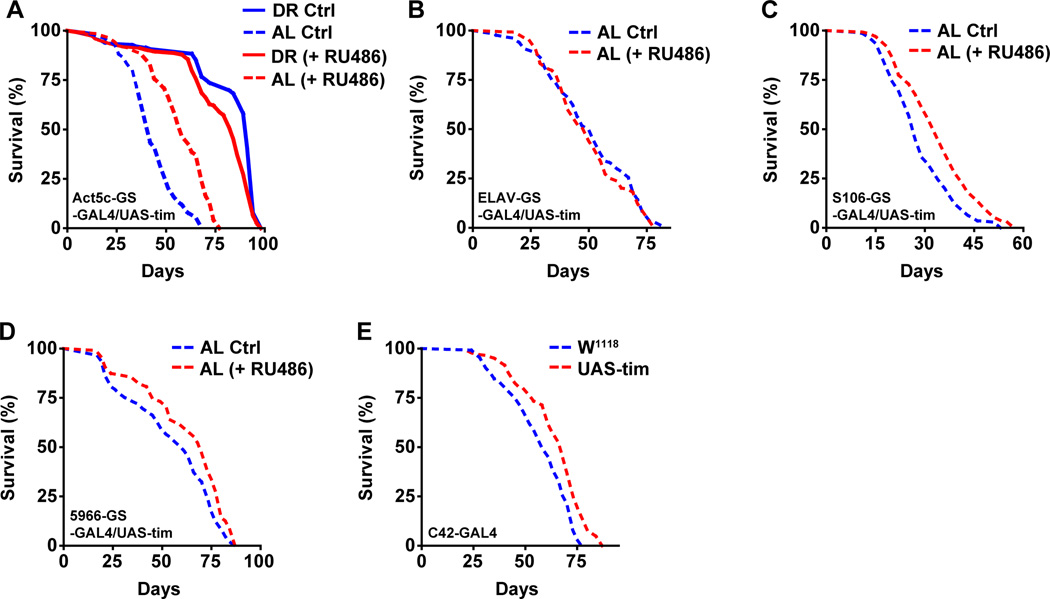
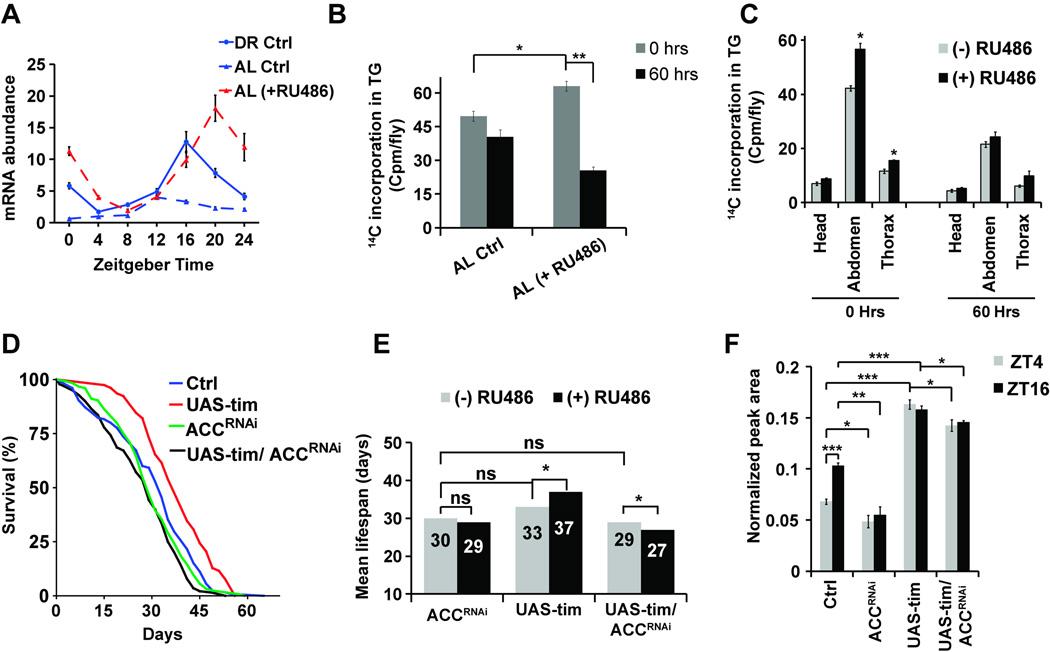
Endogenous circadian clocks orchestrate several metabolic and signaling pathways that are known to modulate lifespan, suggesting clocks as potential targets for manipulation of metabolism and lifespan. We report here that the core circadian clock genes, timeless (tim) and period (per), are required for the metabolic and lifespan responses to DR in Drosophila. Consistent with the involvement of a circadian mechanism, DR enhances the amplitude of cycling of most circadian clock genes, including tim, in peripheral tissues. Mass-spectrometry-based lipidomic analysis suggests a role of tim in cycling of specific medium chain triglycerides under DR. Furthermore, overexpression of tim in peripheral tissues improves its oscillatory amplitude and extends lifespan under ad libitum conditions. Importantly, effects of tim on lifespan appear to be mediated through enhanced fat turnover. These findings identify a critical role for specific clock genes in modulating the effects of nutrient manipulation on fat metabolism and aging.


Figures

Figure 1
Figure 1. Increase in amplitude of circadian gene expression upon DR
Daily relative mRNA concentration profiles of core clock genes in (A) heads and (B) bodies of control CS females fed on AL and DR diets for 10 days. Data are normalized to the trough (ZT4/16) values set at 1 for flies on AL diet for each age. White and black horizontal bars mark periods of light and dark respectively. Each data point represents mean ± SEM of three independent RNA samples. Statistical significance between AL and DR values was determined using two-way ANOVA with Bonferonni’s post hoc test, and is denoted by ***p< 0.001, **p<0.01, and *p<0.05 and is provided in Table S1. See also Figure S1.
Figure 2
Figure 2. Increase in magnitude of clock protein expression upon DR
(A) TIM and PER expression in adult fat body at ZT 4 and 18 in control females fed AL and DR diets for 10 days. (left) TIM staining. (center) PER staining. (right) Merged images (TIM, PER and DAPI). Scale bars indicate 15 µm. (B) Quantification of both TIM and PER expressions in the nucleus. n = 90 from 6 fat bodies in each conditions. Error bars indicate SEM. (* p < 0.05 by t-test).
Figure 3
Figure 3. Reduction of lifespan extension upon DR in flies with mutations in circadian clock genes
DR mediated lifespan extension was reduced in (A) female flies maintained in 24 hr LL, (B) tim01 mutant (in CS background) under LD, and (C) tim01 mutant (in w1118 background) under LD. (D) tim01 flies showed reduced response to varying yeast extract concentration in the diet. (E) Lifespan extension upon DR was reduced in per01 mutants under LD. Statistical analysis of the survival curves, number of flies and data from additional independent repeats are provided in Tables S2–3. See also Figure S2.
Figure 4
Figure 4. Mutations in circadian clock genes reduce triglyceride homeostasis upon DR
Starvation resistance was reduced in tim01 (A) and per01 mutants (B). Statistical analysis of the survival curves, number of flies and data from additional independent repeats are provided in Tables S2–3. (C) tim01 mutant flies show reduced triglyceride turnover upon DR. Flies were fed AL and DR diet containing 14C labeled glucose for 24 hrs and the synthesis of TG was measured (shown as 0 hrs) by measuring the amount of 14C in the TG fraction of the isolated lipids from the flies. Breakdown was measured by a pulse-chase experiment where the 24 hrs fed flies were transferred to unlabelled food for 60 hrs and the remaining 14C label in TG fraction was measured (60 Hrs). Values are mean ± SEM of 5 independent preparations. Statistical significance was determined using Student’s t-test and is denoted between time points is denoted by a,b or c and by (*) between groups. c or *** indicates p< 0.001, b or ** p<0.01, and a or *p<0.05. (D–G) Mass spectrometry-based lipidomics to identify triglycerides (TGs) that cycle upon DR in a timeless-dependent fashion. (D) Extracted ion chromatograms (XICs) for (top) a mixture of synthetic d5-di and triglycerides (predominantly forming the corresponding [M+NH4]+ ions) used to establish and optimize conditions for HPLC-MS and –MS/MS analyses and (middle) ~253 features identified from HPLC-MS analysis of DR fly lipid extracts. For ease of visualization, each chromatogram is plotted to show a 3 min window around the peak of interest. Further, for fly lipid features (bottom), only exemplary peaks are labeled with the corresponding feature number (e.g. feature 88/F88) to avoid any overlap. (E) Levels of specific TGs (error bars, SEM) at different time points in control and tim01 flies maintained on DR food conditions, segregated in three groups based on their cycling nature: group 1: non-cycling, group 2: cycling, peak at night, and group 3: cycling, peak during day. (F) High resolution (HR) HPLC-MS/MS spectra for the most prominent cycling feature (F88). (G) Schematic annotations for the molecular ion ([M+NH4]+) and the observed fragment ions (Figure 4F), based on analysis of HRMS data of feature 88/TG(36:0). See also Figure S3 and S4.
Figure 5
Figure 5. Overexpression of tim increases survival in a diet dependent manner
Kaplan Meier survival analysis of female flies upon tim overexpression under DR (solid line) and AL (dashed line) conditions, control flies (without RU486, blue) and overexpression flies (with RU486, red). (A) Overexpression of tim in whole body increases lifespan on an AL diet. (B) Overexpression of tim specifically in neurons has no effect on lifespan. (C–E) Overexpression of tim specifically in (C) fat body or (D) gut or (E) tubules increases lifespan on AL diet. Statistical analysis of the survival curves, complete genotype, number of flies and data from additional independent repeats are provided in Tables S2–3. See also Figure S5.
Figure 6
Figure 6. Overexpression of tim enhances fat metabolism, which mediates lifespan extension
(A) Overexpression of tim in whole body increases relative abundance of tim mRNA and circadian amplitude of tim expression. The data are normalized to the trough (ZT4) levels seen in control flies on AL diet. Values are mean ± SEM of 3 independent preparations. (B) Overexpression of tim in whole body increases triglyceride turnover upon AL. Values are mean ± SEM of 4 independent preparations. Statistical significance was determined using Student’s t-test and is denoted by ***p< 0.001, **p<0.01, and *p<0.05. (C) Fat body specific overexpression of tim increases triglyceride synthesis specifically in the abdomen and thorax of the flies on AL diet. Values are mean ± SEM of 4–5 independent preparations. Statistical significance was determined using Student’s t-test and *denotes p<0.05. (D) Co-expression of tim overexpression and ACC RNAi in whole body abrogates the AL dependent increase in survival. Kaplan Meier survival analysis of female flies with tim overexpression under AL (with RU486, red) conditions, control flies (without RU486, blue), ACC RNAi (with RU486, green) and tim overexpression with ACC RNAi (with RU486, black). (E) The mean lifespan observed in survival curves shown in (6D). Statistical analysis of the survival curves, complete genotype and number of flies are provided in Table S2 and for an independent repeat see Figure S6. (F) Levels of trilauryl glycerol (TLG) are increased in flies overexpressing tim and are reduced upon ACC RNAi in whole body on AL diet. Values are mean ± SEM of 4 independent preparations. Statistical significance was determined using Student’s t-test and is denoted by *p<0.05, **p<0.01, ***p<0.001.

Comment in

References

    1. Asai M, Yoshinobu Y, Kaneko S, Mori A, Nikaido T, Moriya T, Akiyama M, Shibata S. Circadian profile of Per gene mRNA expression in the suprachiasmatic nucleus, paraventricular nucleus, and pineal body of aged rats. J. Neuro. Res. 2001;66:1133–1139. - PubMed
    1. Beaver LM, Klichko VI, Chow ES, Kotwica-Rolinska J, Williamson M, Orr WC, Radyuk SN, Giebultowicz JM. Circadian regulation of glutathione levels and biosynthesis in Drosophila melanogaster. PLoS One. 2012;7:e50454. - PMC - PubMed
    1. Bishop NA, Guarente L. Genetic links between diet and lifespan: shared mechanisms from yeast to humans. Nat. Rev. Genet. 2007;8:835–844. - PubMed
    1. Bordone L, Guarente L. Calorie restriction, SIRT1 and metabolism: understanding longevity. Nat. Rev. Mol. Cell Biol. 2005;6:298–305. - PubMed
    1. Bruce KD, Hoxha S, Carvalho GB, Yamada R, Wang HD, Karayan P, He S, Brummel T, Kapahi P, Ja WW. High carbohydrate-low protein consumption maximizes Drosophila lifespan. Exp. Gerontol. 2013;48:1129–1135. - PMC - PubMed

Publication types

LinkOut - more resources