. 2015 Dec 3;60(5):755-768.
doi: 10.1016/j.molcel.2015.10.013. Epub 2015 Nov 25.

PARP-1 Activation Requires Local Unfolding of an Autoinhibitory Domain

Affiliations

PARP-1 Activation Requires Local Unfolding of an Autoinhibitory Domain

Jennine M Dawicki-McKenna et al. Mol Cell. .

Abstract

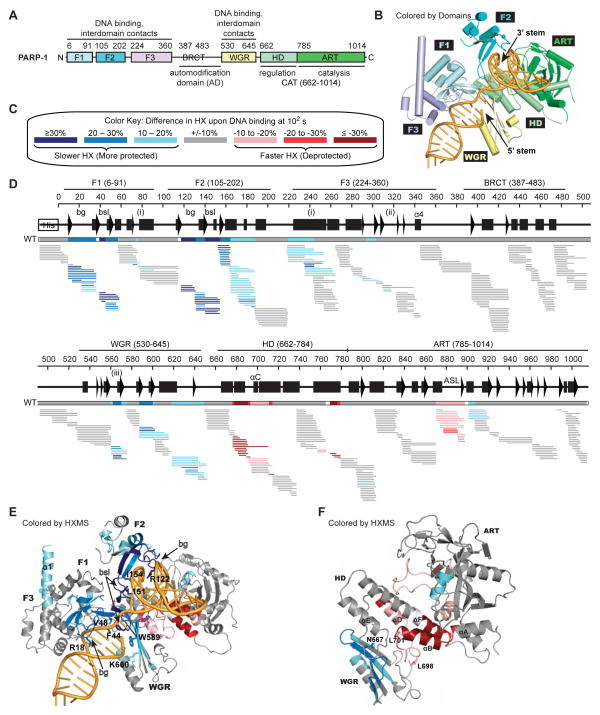
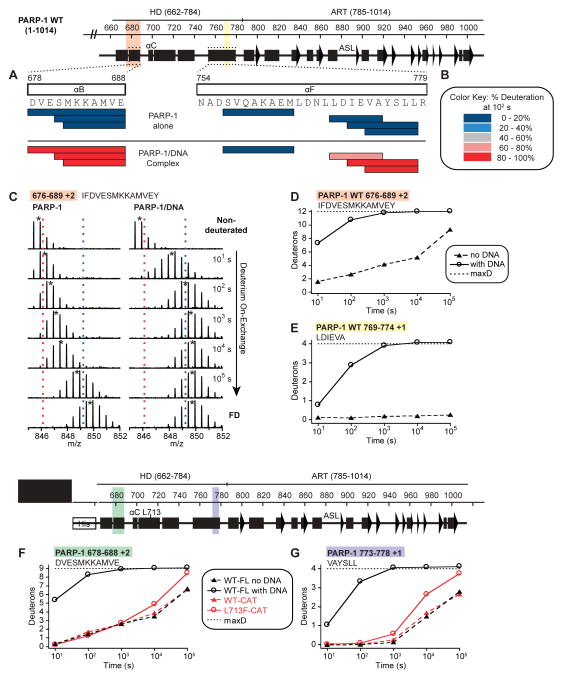
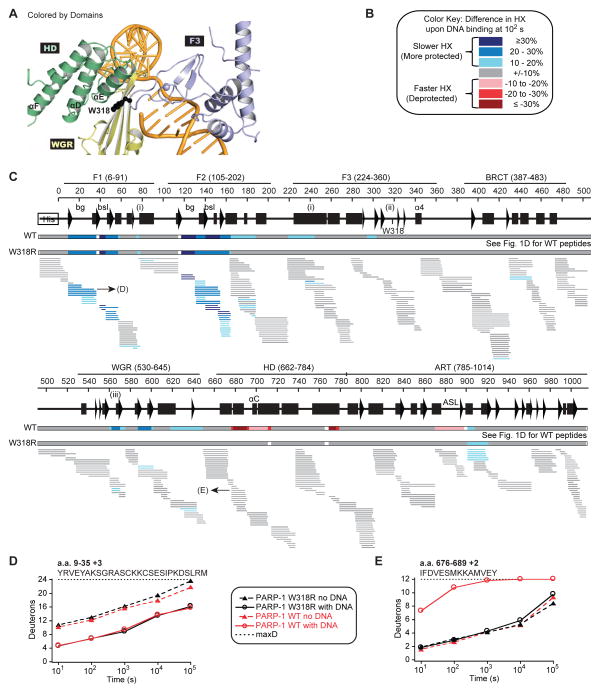
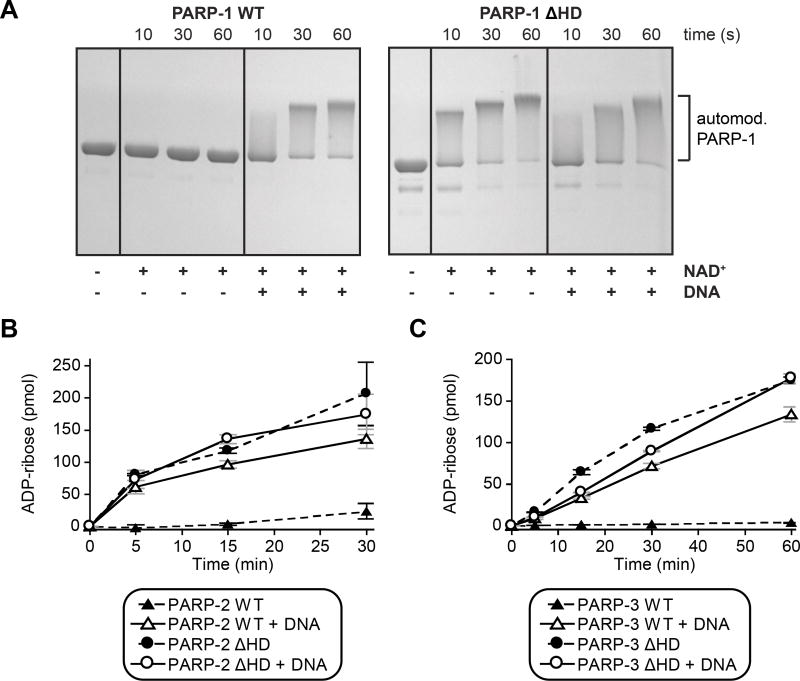
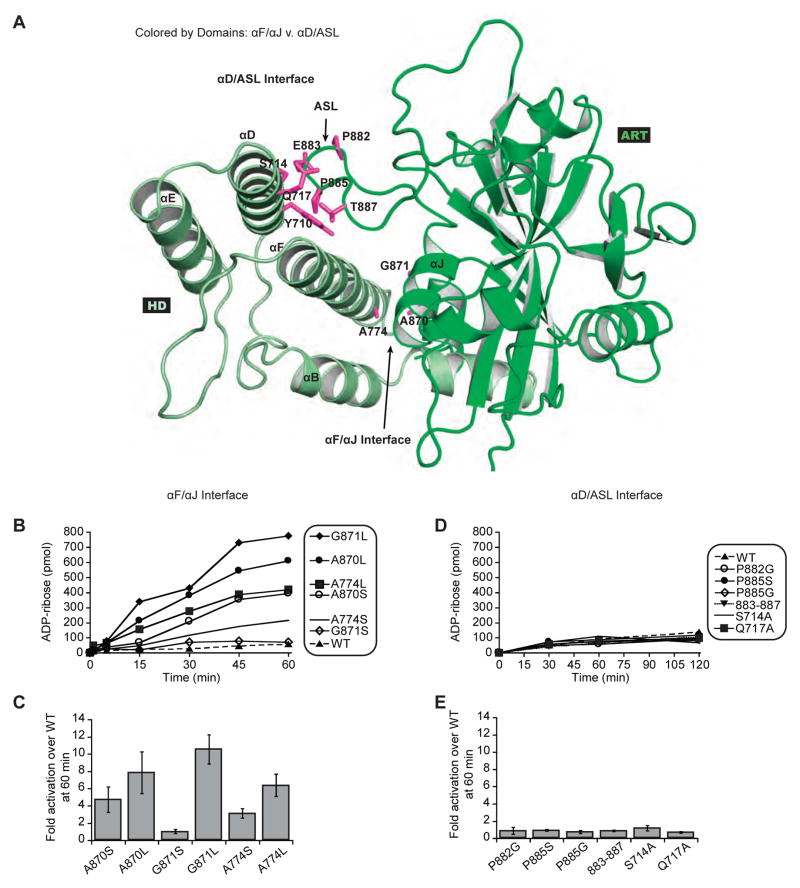
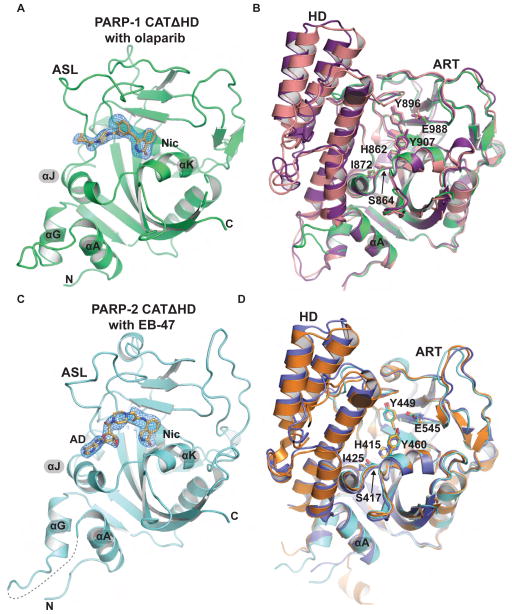
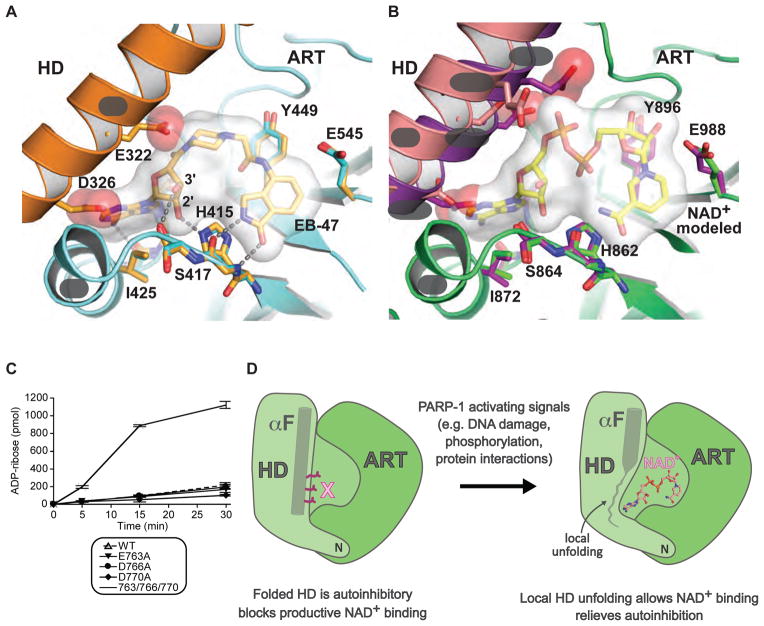
Poly(ADP-ribose) polymerase-1 (PARP-1) creates the posttranslational modification PAR from substrate NAD(+) to regulate multiple cellular processes. DNA breaks sharply elevate PARP-1 catalytic activity to mount a cell survival repair response, whereas persistent PARP-1 hyperactivation during severe genotoxic stress is associated with cell death. The mechanism for tight control of the robust catalytic potential of PARP-1 remains unclear. By monitoring PARP-1 dynamics using hydrogen/deuterium exchange-mass spectrometry (HXMS), we unexpectedly find that a specific portion of the helical subdomain (HD) of the catalytic domain rapidly unfolds when PARP-1 encounters a DNA break. Together with biochemical and crystallographic analysis of HD deletion mutants, we show that the HD is an autoinhibitory domain that blocks productive NAD(+) binding. Our molecular model explains how PARP-1 DNA damage detection leads to local unfolding of the HD that relieves autoinhibition, and has important implications for the design of PARP inhibitors.


Figures

Figure 1
Figure 1. PARP-1 DNA damage detection leads to major decreases in HX in DNA-binding domains, and a dramatic increase in HX in the HD
(A) PARP-1 domain architecture. (B) Combined model of the crystal structure of the PARP-1 (F1, F3, WGR–CAT)/DNA complex, and the NMR structure of F1–F2 in complex with an SSB (Eustermann et al., 2015). (C) Color key for the binning of HX differences. Percent difference is calculated by subtracting the percent deuteration of PARP-1 in complex with DNA from that of PARP-1 alone. (D) Percent difference in HX is calculated for each peptide (represented by horizontal bars) at the 100 s time point and plotted using the color key in (C). The consensus behavior at each PARP-1 residue is displayed in the horizontal bar below the secondary structure annotation. White coloring indicates a gap in peptide coverage. Code for structural elements: bg, backbone grip; bsl, base stacking loop; (i), F1–F3 interface; (ii), F3–WGR–HD interface; (iii), WGR–HD interface. These peptides were identified in a single experiment, for which we have corresponding peptide data across all of the time points (see Fig. S3A). When available, we present the data for all measurable charge states of the 393 unique peptides. (E, F) Consensus HXMS data from (D) is mapped onto the structure of the DNA binding interfaces in (E), and the WGR and CAT domains alone in (F). See also Figures S1–S2.
Figure 2
Figure 2. Regions of the HD αB and αF helices unfold when PARP-1 is bound to DNA damage
(A) The percentage deuteration of peptides (represented by horizontal bars) in which all measureable residues unequivocally map within either αB or αF helices is plotted for PARP-1 alone and the PARP-1/DNA complex at the 100 s time point using the color key in panel (B). (B) Color key for the binning of percentage deuteration. (C) Raw MS data of a representative peptide from αB of PARP-1 HD. Centroid values are indicated with an asterisk. Red and blue dotted lines serve as guides for visualizing differences. FD represents the fully deuterated condition used for normalization due to back-exchange. (D, E) HXMS of representative peptides from the αB in (D), and the C-terminal end of αF in (E) for PARP-1 alone and PARP-1 in complex with DNA. The calculated maximum number of exchangeable deuterons (maxD) is indicated. (F, G) HXMS of representative peptides from the αB in (F), and the C-terminal end of αF in (G) for PARP-1 CAT WT and PARP-1 CAT L713F, drawn in red lines. The same peptides from FL PARP-1 WT are plotted for comparison (black lines). See also Figures S3–S4.
Figure 3
Figure 3. Disruption of PARP-1 interdomain communication prevents HD unfolding
(A) Location of residue W318 (shown as sticks) at the interface of the F3, WGR, and HD domains. (B) and (C) Same as Fig. 1C and 1D for PARP-1 W318R. When available, we present the data for all measurable charge states of the 391 unique peptides. A horizontal bar representing PARP-1 WT data from Fig. 1D is shown for comparison. (D, E) HXMS of specific W318R peptides for the F1 domain in (D), and αB in (E), drawn in black lines. The same peptides from PARP-1 WT are plotted for comparison (red lines). The calculated maximum number of exchangeable deuterons (maxD) is indicated. See also Figure S5.
Figure 4
Figure 4. The HD is an autoinhibitory domain of DNA damage-dependent PARPs
(A) Catalytic activity of PARP-1 FL WT and PARP-1 ΔHD (1 μM) in the absence or presence of DNA (1 μM) measured using the SDS-PAGE automodification assay. (B, C) Catalytic activity of PARP-2 and PARP-3 WT and ΔHD mutants (PARP-2: 20 nM, DNA: 20 nM; PARP-3: 60 nM, DNA: 480 nM) measured using the colorimetric assay. Experiments were performed in triplicate and the averages and standard deviations are shown. See also Figure S6.
Figure 5
Figure 5. Disruption of HD–ART contacts mediated by αF/αJ increases PARP-1 DNA-independent activity
(A) Location of mutations at the αF/αJ interface versus the ASL/αD interface. (B) and (D) DNA-independent catalytic activity of PARP-1 FL WT and mutants (60 nM) using the colorimetric assay. (C) and (E) Fold activation over PARP-1 FL WT at 60 minutes presented as an average of three independent experiments with the associated standard deviation. See also Figure S6.
Figure 6
Figure 6. Crystal structure analysis of constitutively hyperactive PARP-1 and PARP-2
(A) Crystal structure of PARP-1 CATΔHD (green) bound to olaparib (PDB code 5ds3). The weighted FO-FC difference electron density prior to modeling olaparib is shown, with the final olaparib coordinates overlayed. The locations of the nicotinamide binding pocket (Nic) and the active site loop (ASL) are labeled. (B) Structural alignment of a PARP-1 catalytic domain crystal structure (purple, 1a26), the catalytic domain extracted from the PARP-1/DNA crystal structure (pink, 4dqy), and the PARP-1 CATΔHD/olaparib structure (green). Key NAD+ binding site residues are drawn as sticks and labeled. (C) Crystal structure of PARP-2 CATΔHD (cyan) bound to EB-47 (PDB code 5dsy). The weighted FO-FC difference electron density prior to modeling EB-47 is shown, with the final EB-47 coordinates overlayed. The locations of the nicotinamide binding pocket (Nic) and the adenosine binding site (AD) are labeled. (D) PARP-2 catalytic domain crystal structures (orange, 1gs0; blue, 3kjd) aligned to the PARP-2 CATΔHD/EB-47 structure (cyan). See also Figure S6 and Table 1.
Figure 7
Figure 7. The HD is an autoinhibitory domain that blocks productive NAD+ binding
(A) The catalytic active site of PARP-2 CATΔHD/EB-47 structure. A complete HD-ART catalytic domain structure for PARP-2 (1gs0, in orange) was aligned to PARP-2 CATΔHD (5dsy, in cyan), highlighting the conserved position of key ART domain residues, and steric clashes introduced by the positioning of residues on αF. (B) NAD+ was modeled in the active site of PARP-1 based on adenosine contacts observed in the PARP-2/EB-47 structure and nicotinamide contacts observed in toxin structures (e.g. Diptheria toxin). Key NAD+ binding residues are shown for PARP-1 CATΔHD (green, 5ds3), chicken PARP-1 (purple, 1a26), and the PARP-1/DNA complex (pink, 4dqy). αF residues that project toward the NAD+ binding site are drawn as sticks (D770, D766, E763/Q763; chicken PARP-1 has a Gln residue at position 763). (C) DNA-independent catalytic activity of three single mutants and a combined triple mutant located on αF compared to WT PARP-1. Experiments were performed in triplicate and the averages and standard deviations are shown. (D) Model for PARP-1 catalytic domain changes associated with activating signals.

References

    1. Adams PD, Afonine PV, Bunkoczi G, Chen VB, Davis IW, Echols N, Headd JJ, Hung LW, Kapral GJ, Grosse-Kunstleve RW, et al. PHENIX: a comprehensive Python-based system for macromolecular structure solution. Acta Crystallogr D Biol Crystallogr. 2010;66:213–221. - PMC - PubMed
    1. Ali AA, Timinszky G, Arribas-Bosacoma R, Kozlowski M, Hassa PO, Hassler M, Ladurner AG, Pearl LH, Oliver AW. The zinc-finger domains of PARP1 cooperate to recognize DNA strand breaks. Nat Struct Mol Biol. 2012;19:685–92. - PMC - PubMed
    1. Altmeyer M, Messner S, Hassa PO, Fey M, Hottiger MO. Molecular mechanism of poly(ADP-ribosyl)ation by PARP1 and identification of lysine residues as ADP-ribose acceptor sites. Nucleic Acids Res. 2009;37:3723–3738. - PMC - PubMed
    1. Ame JC, Spenlehauer C, de Murcia G. The PARP superfamily. Bioessays. 2004;26:882–893. - PubMed
    1. Andrabi SA, Umanah GK, Chang C, Stevens DA, Karuppagounder SS, Gagne JP, Poirier GG, Dawson VL, Dawson TM. Poly(ADP-ribose) polymerase-dependent energy depletion occurs through inhibition of glycolysis. Proc Natl Acad Sci U S A. 2014;111:10209–10214. - PMC - PubMed

Publication types