. 2015 Dec 17;60(6):953-65.
doi: 10.1016/j.molcel.2015.10.029. Epub 2015 Nov 25.

Massively Systematic Transcript End Readout, "MASTER": Transcription Start Site Selection, Transcriptional Slippage, and Transcript Yields

Affiliations

Massively Systematic Transcript End Readout, "MASTER": Transcription Start Site Selection, Transcriptional Slippage, and Transcript Yields

Irina O Vvedenskaya et al. Mol Cell. .

Abstract

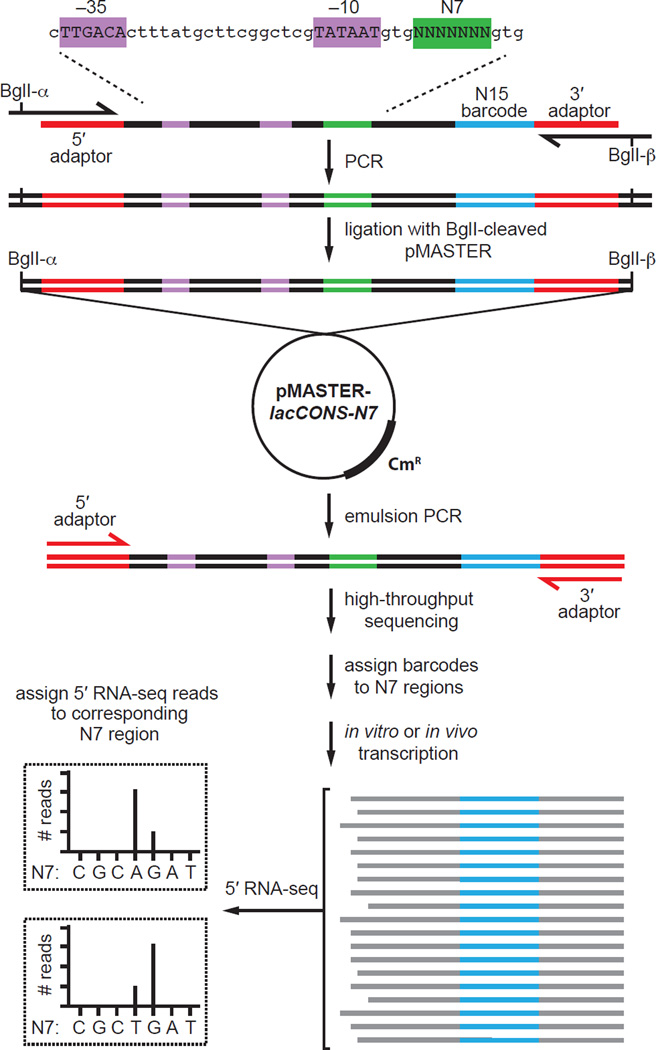
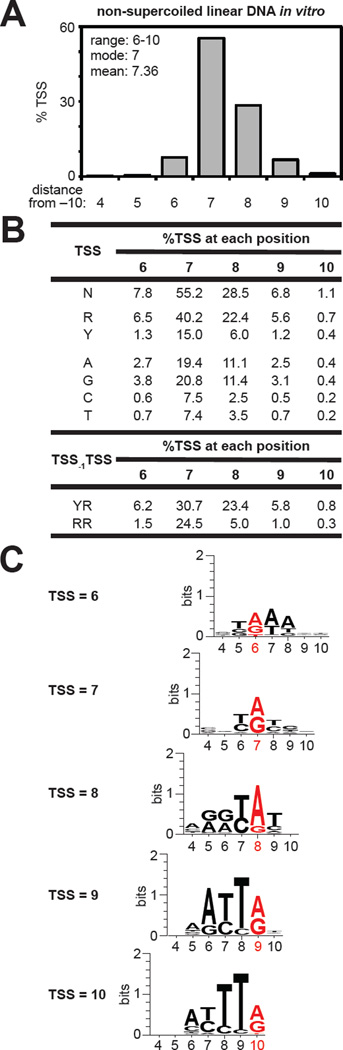
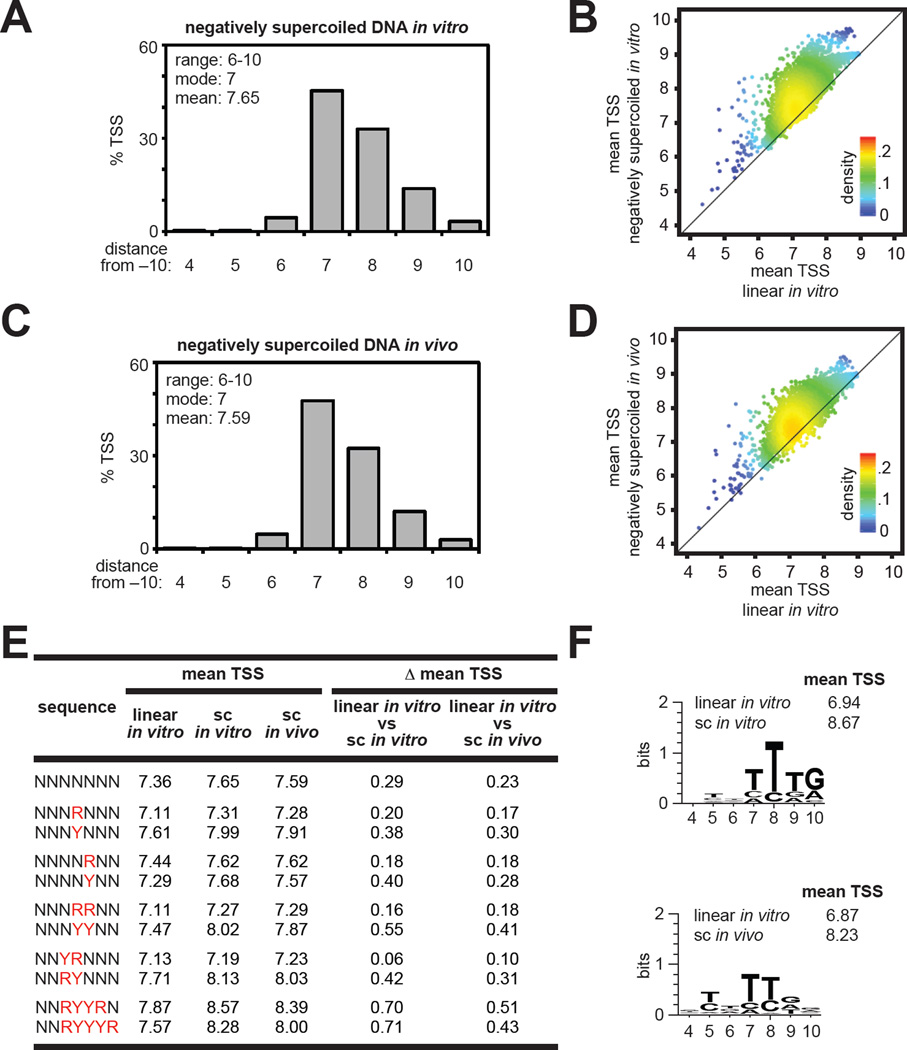
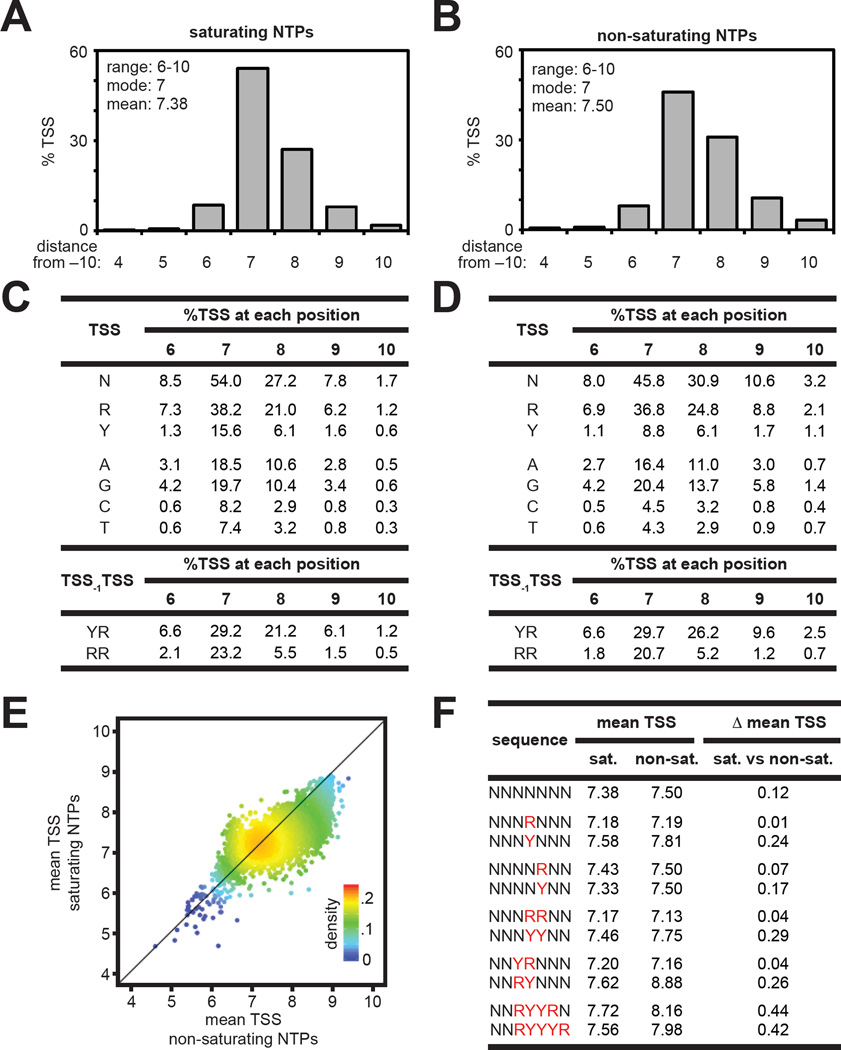
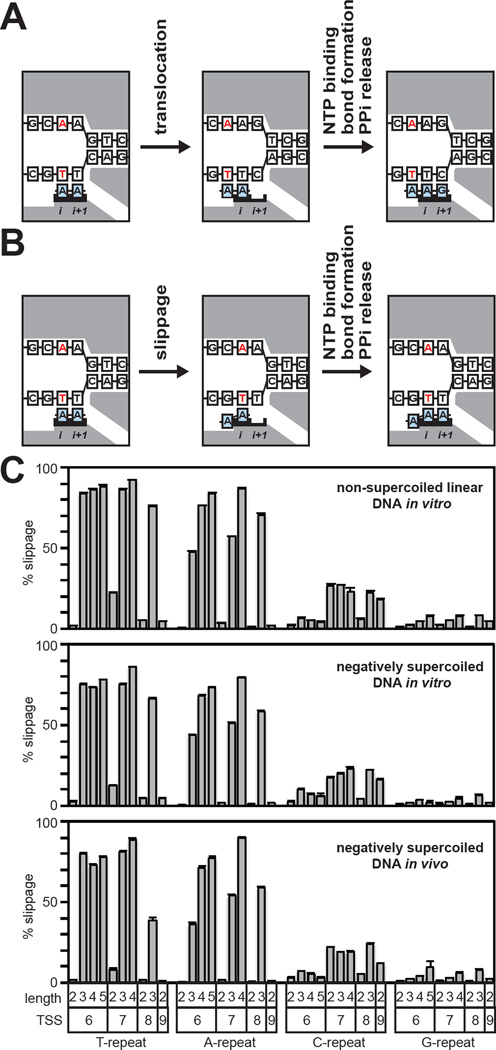
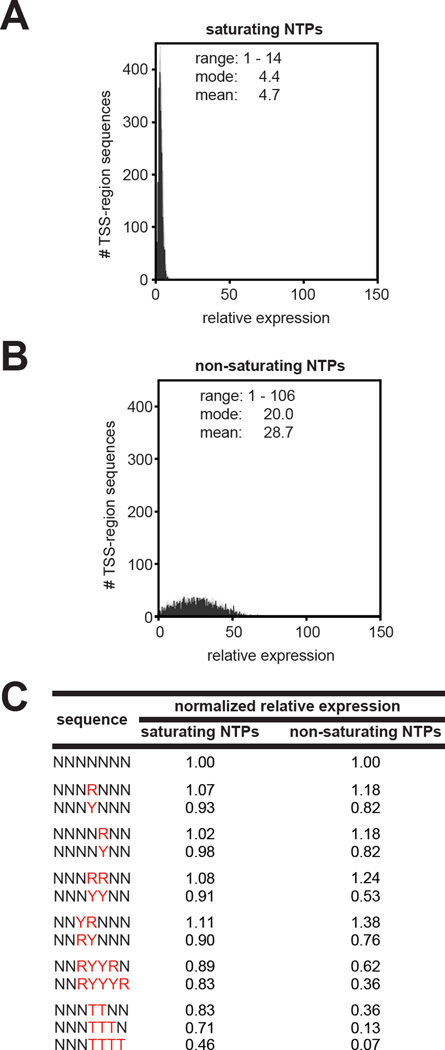
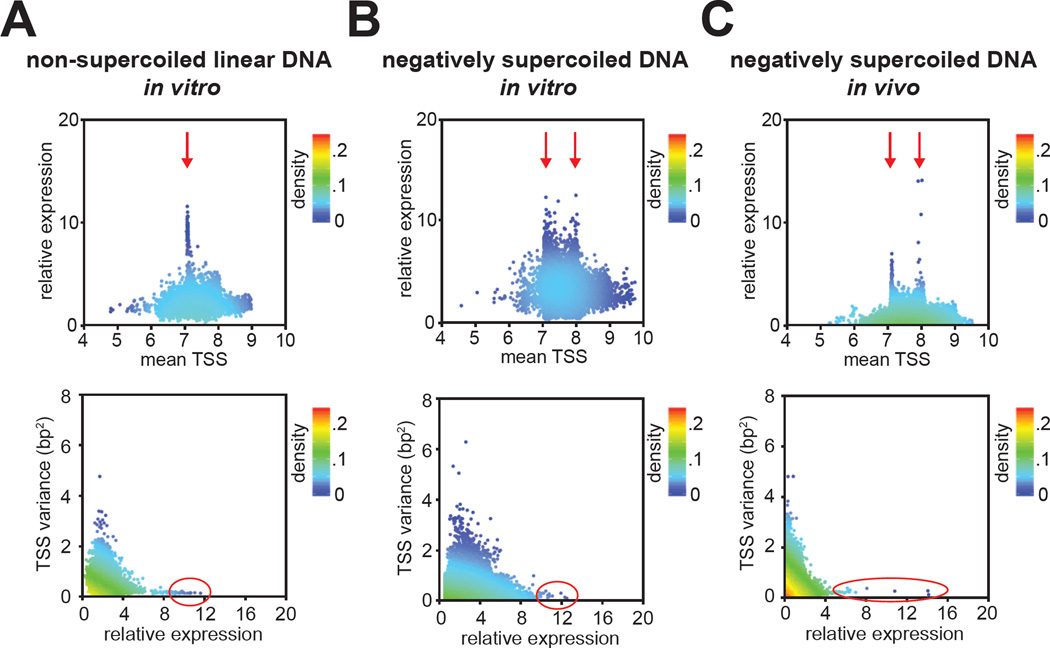
We report the development of a next-generation sequencing-based technology that entails construction of a DNA library comprising up to at least 4(7) (∼ 16,000) barcoded sequences, production of RNA transcripts, and analysis of transcript ends and transcript yields (massively systematic transcript end readout, "MASTER"). Using MASTER, we define full inventories of transcription start sites ("TSSomes") of Escherichia coli RNA polymerase for initiation at a consensus core promoter in vitro and in vivo; we define the TSS-region DNA sequence determinants for TSS selection, reiterative initiation ("slippage synthesis"), and transcript yield; and we define effects of DNA topology and NTP concentration. The results reveal that slippage synthesis occurs from the majority of TSS-region DNA sequences and that TSS-region DNA sequences have profound, up to 100-fold, effects on transcript yield. The results further reveal that TSSomes depend on DNA topology, consistent with the proposal that TSS selection involves transcription-bubble expansion ("scrunching") and transcription-bubble contraction ("anti-scrunching").


Figures

Figure 1
Figure 1. Massively systematic transcript end readout (MASTER)
Top: generation of pMASTER-lacCONS-N7 library. An oligodeoxyribonucleotide carrying the lacCONS-N7 promoter and 15-nt barcode sequence (blue) is used as template in a PCR reaction using primers that introduce BglI sites. The BglI digested PCR product is cloned into BglI digested plasmid pSG289 (Figure S1A) to generate plasmid pMASTER-lacCONS-N7, which contains 47 (~16,000) sequences at positions 4–10 bps downstream of the lacCONS −10 element (green). Middle: product generated by emulsion PCR is used for high-throughput sequencing analysis to assign barcodes to TSS-sequence variants. PCR primers shown in red (5′ and 3′ adaptor) carry sequences that facilitate analysis using an Illumina HiSeq. Bottom: 5′ RNA-seq analysis of RNA produced from the library in vitro and in vivo. The sequence of the barcode is used to assign the RNA to a TSS-region, the sequence of the 5′ end is used to define the TSS, and the number of reads is used to measure transcript yield from each TSS-region sequence. (See Figure S1)
Figure 2
Figure 2. TSS selection on a non-supercoiled linear DNA template in vitro
A. TSS-distribution histogram. Average %TSS at positions 4–10 for TSS-regions with ≥25 matched RNA reads (Table S1). B. Sequence determinants for TSS selection. Table lists the amount of the total %TSS at positions 6–10 derived from TSS-regions carrying (i) R or Y at the indicated TSS position, (ii) A, G, C, or T at the indicated TSS position, or (iii) YTSS-1RTSS or RTSS-1RTSS at the indicated TSS position. C. Sequence preferences for TSS selection. Sequence logo for the 162 TSS-region sequences (top 1%) with the highest %TSS at positions 6–10. Red bases indicate the TSS. (See Figure S3)
Figure 3
Figure 3. TSS selection on negatively supercoiled DNA templates
A. TSS-distribution histogram for experiments performed in vitro. Average %TSS at positions 4–10 for TSS-regions with ≥25 matched RNA reads (Table S2). B. Plot of the mean TSS with negatively supercoiled DNA in vitro versus the mean TSS with non-supercoiled linear DNA in vitro for individual TSS-region sequences. C. TSS-distribution histogram for experiments performed in vivo. Average %TSS at positions 4–10 for TSS-regions with ≥25 matched RNA reads (Table S3). D. Plot of the mean TSS with negatively supercoiled DNA in vivo versus the mean TSS with non-supercoiled linear DNA in vitro for individual TSS-region sequences. E. Average of the mean TSS values for the indicated TSS-region sequences. (Δ mean TSS; differences between values observed on linear and supercoiled templates). F. Sequence preferences for topology dependent effects on TSS selection. Sequence logo and average mean TSS values for 162 TSS-region sequences (top 1%) with the highest values of Δ mean TSS. (See Figure S4)
Figure 4
Figure 4. Effects of NTP concentrations on TSS selection in vitro
A. and B. TSS-distribution histograms at saturating (A) and non-saturating (B) NTP concentrations in vitro. Average %TSS at positions 4–10 for TSS-regions with ≥25 matched RNA reads (Tables S4 and S5). Experiments were performed at 2.5 mM NTPs:Mg2+ (saturating) or 0.1 mM NTPs (non-saturating) using a non-supercoiled linear DNA template. C. and D. Sequence determinants for TSS selection. (C, saturating NTPs; D, non-saturating NTPs) E. Plot of the mean TSS at saturating NTP concentrations versus non-saturating NTP concentrations for individual TSS-region sequences. F. Average of the mean TSS values observed for the indicated TSS-region sequences at saturating (sat.) and non-saturating (non-sat.) NTP concentrations. (Δ mean TSS; differences between values observed at saturating and non-saturating NTP concentrations)
Figure 5
Figure 5. Comprehensive analysis of productive slippage synthesis
A. Nucleotide addition cycle for the standard pathway of transcription initiation. Left: initial transcribing complex with a 2-nt RNA in a pre-translocated state. Middle: initial transcribing complex with a 2-nt RNA in a post-translocated state. Right: 3-nt product complex in a pre-translocated state. The RNA and DNA template strand remain in lock-step register and the sequence of the RNA is fully complementary to the template strand. White boxes, DNA; blue boxes, RNA; gray shading, RNAP; red, TSS bases; i and i+1, RNAP active-center i and i+1 sites. B. Nucleotide addition cycle for the slippage pathway. Left: initial transcribing complex with a 2-nt RNA in a pre-translocated state. Middle: RNA has moved backward relative to the DNA template by one base. Right: 3-nt product complex in a pre-translocated state. The 5′ end of the RNA carries an RNA/DNA difference and is not complementary to the template strand. C. Analysis of productive slippage synthesis. Graphs show % slippage (mean + SEM) for TSS-region sequences containing 5′ end homopolymeric repeat sequences of the indicated length that begin at the indicated position (TSS). (See Figure S5)
Figure 6
Figure 6. Effects of NTP concentrations on transcript yields in vitro
A. and B. Relative expression histograms for experiments performed at saturating NTP (A) and non-saturating (B) NTP concentrations using a non-supercoiled linear DNA template in vitro. Relative expression for TSS-region sequences with ≥ 25 total RNA reads for which the number of DNA templates was not in the top or bottom 10% (Tables S4 and S5). For each experimental condition the lowest value of relative expression was normalized to 1. C. Normalized relative expression for the indicated TSS-region sequences. Values were calculated by dividing the average relative expression for the indicated TSS-region sequence by the relative expression observed for all TSS-region sequences. (See Figure S6)
Figure 7
Figure 7. Precision of TSS selection is a determinant of transcript yield
Top: plot of relative expression versus mean TSS. Bottom: plot of TSS variance versus relative expression.

Comment in

References

    1. Aoyama T, Takanami M. Essential structure of E. coli promoter II. Effect of the sequences around the RNA start point on promoter function. Nucleic Acids Res. 1985;13:4085–4096. - PMC - PubMed
    1. Dangkulwanich M, Ishibashi T, Bintu L, Bustamante C. Molecular mechanisms of transcription through single-molecule experiments. Chem. Rev. 2014;114:3203–3223. - PMC - PubMed
    1. Hawley DK, McClure WR. Compilation and analysis of Escherichia coli promoter DNA sequences. Nucleic Acids Res. 1983;11:2237–2255. - PMC - PubMed
    1. Heyduk E, Heyduk T. Next generation sequencing-based parallel analysis of melting kinetics of 4096 variants of a bacterial promoter. Biochemistry. 2014;53:282–292. - PMC - PubMed
    1. Heyduk T, Heyduk E. Next Generation Sequencing-based analysis of RNA polymerase functions. Methods. 2015 - PubMed

Publication types

MeSH terms

Associated data

LinkOut - more resources