Randomized Controlled Trial
. 2016 Feb 11;127(6):749-60.
doi: 10.1182/blood-2015-04-640128. Epub 2015 Dec 1.

Effect of lenalidomide treatment on clonal architecture of myelodysplastic syndromes without 5q deletion

Affiliations
Randomized Controlled Trial

Effect of lenalidomide treatment on clonal architecture of myelodysplastic syndromes without 5q deletion

Virginie Chesnais et al. Blood. .

Abstract

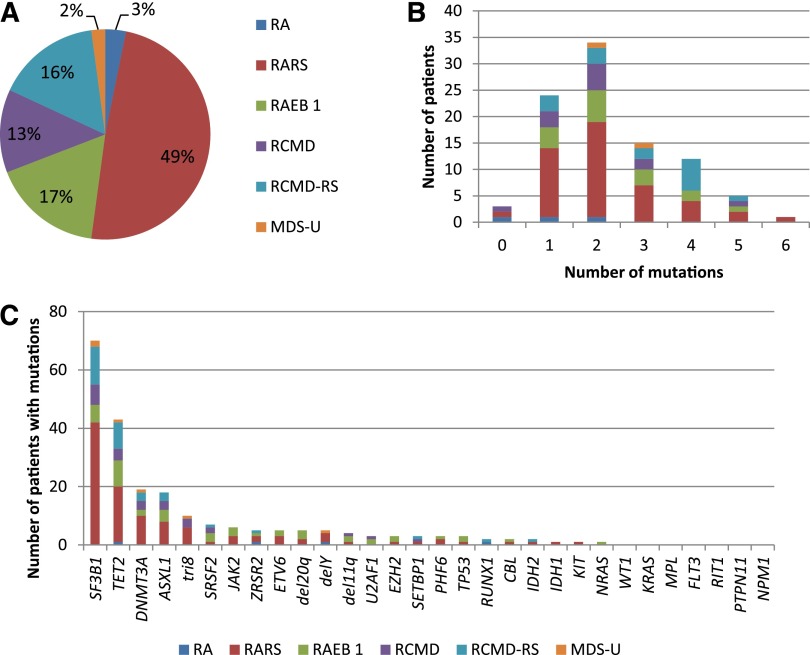
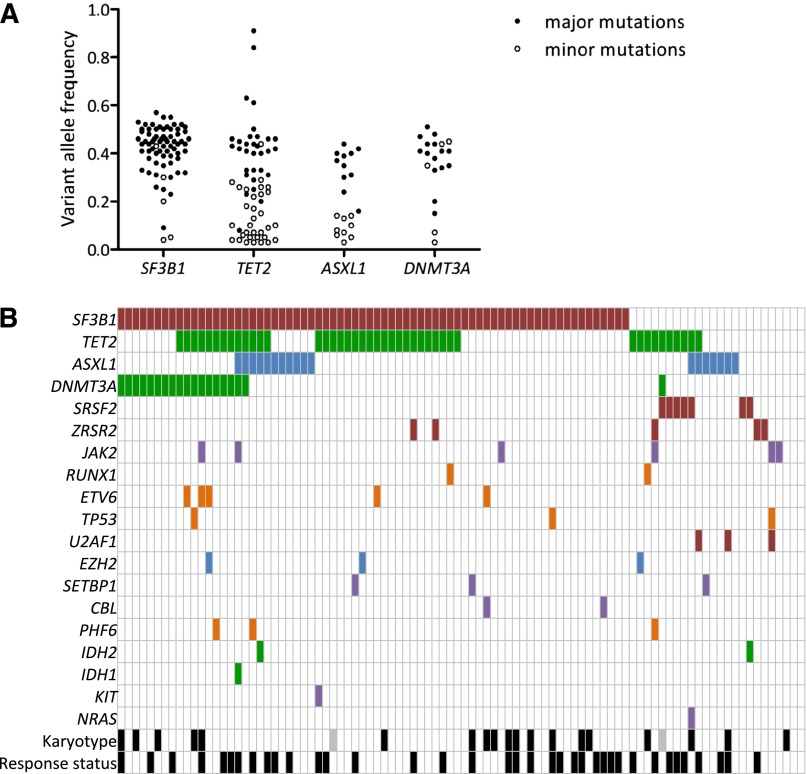
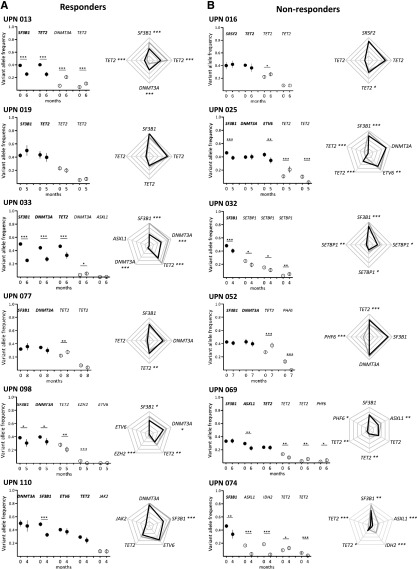
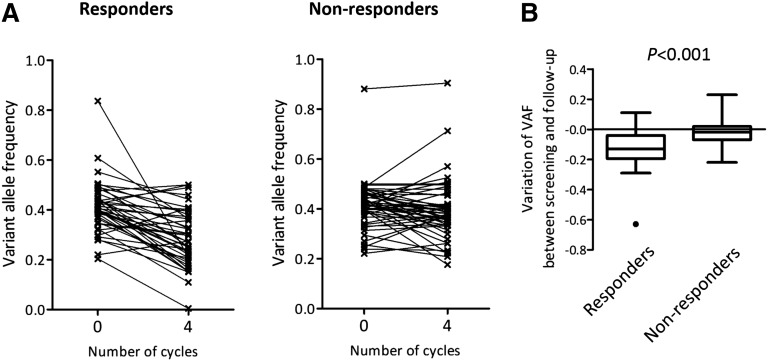
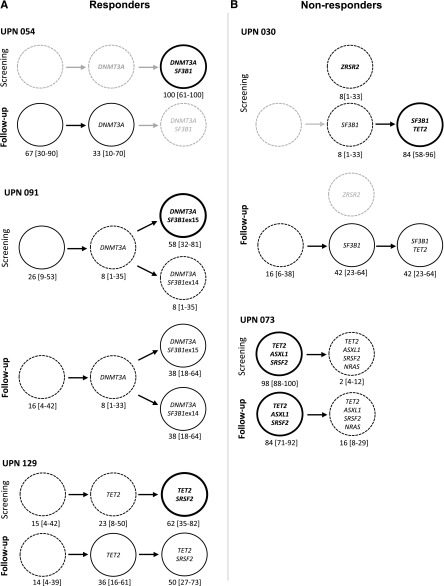
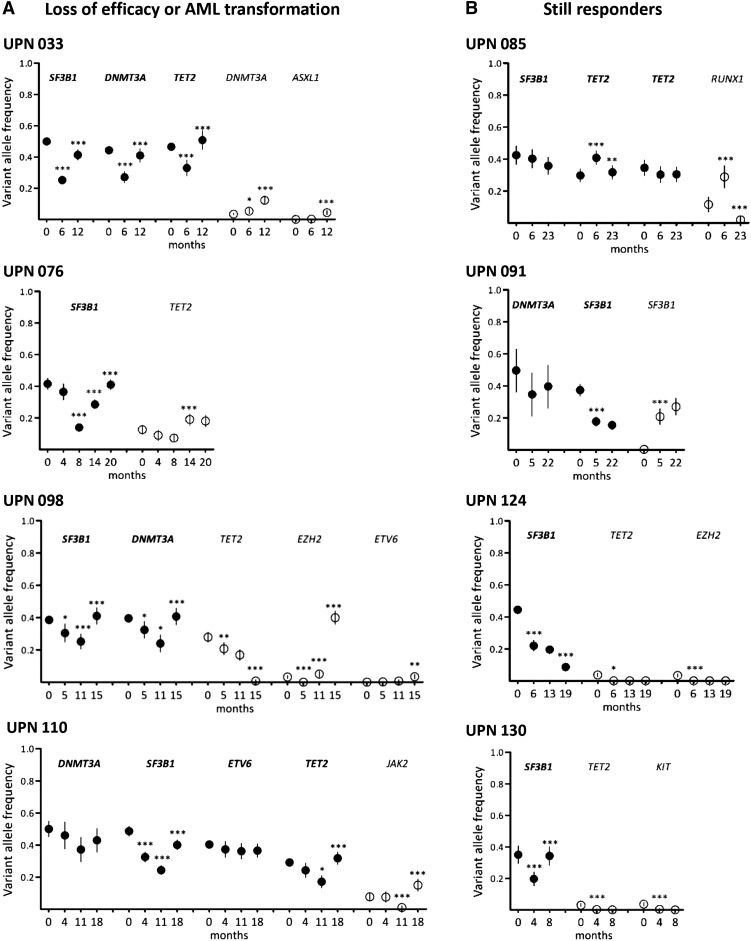
Non-del(5q) transfusion-dependent low/intermediate-1 myelodysplastic syndrome (MDS) patients achieve an erythroid response with lenalidomide in 25% of cases. Addition of an erythropoiesis-stimulating agent could improve response rate. The impact of recurrent somatic mutations identified in the diseased clone in response to lenalidomide and the drug's effects on clonal evolution remain unknown. We investigated recurrent mutations by next-generation sequencing in 94 non-del(5q) MDS patients randomized in the GFM-Len-Epo-08 clinical trial to lenalidomide or lenalidomide plus epoetin β. Clonal evolution was analyzed after 4 cycles of treatment in 42 cases and reanalyzed at later time points in 18 cases. The fate of clonal architecture of single CD34(+)CD38(-) hematopoietic stem cells was also determined in 5 cases. Mutation frequency was >10%: SF3B1 (74.5%), TET2 (45.7%), DNMT3A (20.2%), and ASXL1 (19.1%). Analysis of variant allele frequencies indicated a decrease of major mutations in 15 of 20 responders compared with 10 of 22 nonresponders after 4 cycles. The decrease in the variant allele frequency of major mutations was more significant in responders than in nonresponders (P < .001). Genotyping of single CD34(+)CD38(-) cell-derived colonies showed that the decrease in the size of dominant subclones could be associated with the rise of founding clones or of hematopoietic stem cells devoid of recurrent mutations. These effects remained transient, and disease escape was associated with the re-emergence of the dominant subclones. In conclusion, we show that, although the drug initially modulates the distribution of subclones, loss of treatment efficacy coincides with the re-expansion of the dominant subclone. This trial was registered at www.clinicaltrials.gov as #NCT01718379.


Figures

Figure 1
Figure 1
Genotyping of 94 low/int-1 MDS patients using a panel of 26 genes. (A) Repartition of WHO subtypes. (B) Number of patients of each WHO subtype having 0 to 6 mutations. (C) Number of patients of each WHO subtype exhibiting genetic or cytogenetic lesions. SF3B1, TET2, DNMT3A, and ASXL1 mutations were the most frequent genetic events in the cohort.
Figure 2
Figure 2
Landscape of mutations. (A) Distribution of variant allele frequencies of SF3B1, TET2, ASXL1, and DNMT3A gene mutations at inclusion. For each mutation, depth at the variant position was considered to calculate variant allele frequency; that is, the proportion of mutated reads among total reads and its 95% CI. For each patient having at least 1 of the 4 SF3B1, TET2, ASXL1, or DNMT3A mutations, pairwise comparisons between the variant allele frequencies of mutations were performed using Fisher’s exact test. Mutations with the significantly highest variant allele frequencies were considered major mutations and are indicated by closed symbols; minor mutations are indicated by open symbols. (B) Barcode representation of genetic lesions, cytogenetic abnormalities, and response status of 94 patients. Two patients had no mutation and a normal karyotype. Each column represents an individual sample, and each row represents a gene. Black boxes represent abnormal karyotypes and responders to treatment. Gray boxes represent unavailable karyotype.
Figure 3
Figure 3
Clonal evolution after short-term treatment with lenalidomide. Results from 6 responders (A) and 6 nonresponders (B) are shown. Other results from 30 additional patients are available in supplemental Figure 2. Paired BM mononuclear cell samples (n = 42) were collected for genotyping before and after 4 cycles of treatment expressed in months of follow-up. Depth at the variant position was considered to calculate variant allele frequency and its 95% CI. For each patient, variant allele frequencies of a given mutation were compared between 2 consecutive time points of the follow-up period using Fisher’s exact test. Left: dot representation; closed symbols represent major mutations and open symbols represent minor mutations for each patient. Vertical bars represent 95% CIs. Right: radar plots of the variant allele frequencies at inclusion and after 4 cycles of treatment. Maximum scale value is 50%, with intervals of 10%. Each extremity of the spider web represents 1 mutation. Gray lines indicate the variant allele frequencies at inclusion and black lines indicate the variant allele frequencies after treatment. In both panels, significant differences between the 2 time points are indicated. *P < .05; **P < .01; ***P < .001. UPN, unique patient number.
Figure 4
Figure 4
Evolution of variant allele frequency of dominant mutations in responders and nonresponders to lenalidomide after short-term treatment. (A) Variant allele frequency of each major mutation was shown before (0 cycles) and after 4 cycles of treatment in responders (n = 20; left) and nonresponders (n = 22; right). (B) Variation of variant allele frequency was calculated as follow-up minus screening for each responder and each nonresponder. Box plots represent medians and IQRs [25%–75%], and whiskers extend to 1.5 times the IQR. Variations are compared between responders and nonresponders using the Mann Whitney U test.
Figure 5
Figure 5
Genotyping of single HSC–derived colonies. (A) Responders. (B) Nonresponders. Graphic representation of clonal architecture of HSC compartment at the single-cell level before and after 4 cycles of treatment. Percentages of mutated colonies and 95% CIs are indicated for each patient. Bold lines are used for dominant subclones, standard and dotted lines for minor subclones, and gray lines for undetected subclones.
Figure 6
Figure 6
Long-term follow-up of clonal evolution under treatment by lenalidomide. Sequential samples of BM mononuclear cells were collected from 18 responder patients. Results from 4 patients with loss of efficacy or AML transformation (A) and 4 still responders (B) are shown. Other results from 10 additional patients are available in supplemental Figure 3. Depth at the variant position was considered to calculate variant allele frequency and its 95% CI. For each patient, variant allele frequencies of a given mutation were compared between 2 consecutive time points (indicated in months) of the follow-up period using Fisher’s exact test. *P < .05; **P < .01; ***P < .001. Closed symbols represent dominant mutations and open symbols represent minor mutations.

References

    1. List A, Dewald G, Bennett J, et al. Myelodysplastic Syndrome-003 Study Investigators. Lenalidomide in the myelodysplastic syndrome with chromosome 5q deletion. N Engl J Med. 2006;355(14):1456–1465. - PubMed
    1. Fenaux P, Giagounidis A, Selleslag D, et al. MDS-004 Lenalidomide del5q Study Group. A randomized phase 3 study of lenalidomide versus placebo in RBC transfusion-dependent patients with Low-/Intermediate-1-risk myelodysplastic syndromes with del5q. Blood. 2011;118(14):3765–3776. - PubMed
    1. Le Bras F, Sebert M, Kelaidi C, et al. Treatment by Lenalidomide in lower risk myelodysplastic syndrome with 5q deletion--the GFM experience. Leuk Res. 2011;35(11):1444–1448. - PubMed
    1. Adès L, Le Bras F, Sebert M, et al. Treatment with lenalidomide does not appear to increase the risk of progression in lower risk myelodysplastic syndromes with 5q deletion. A comparative analysis by the Groupe Francophone des Myelodysplasies. Haematologica. 2012;97(2):213–218. - PMC - PubMed
    1. Kuendgen A, Lauseker M, List AF, et al. International Working Group on MDS with del(5q) Lenalidomide does not increase AML progression risk in RBC transfusion-dependent patients with Low- or Intermediate-1-risk MDS with del(5q): a comparative analysis. Leukemia. 2013;27(5):1072–1079. - PMC - PubMed

Publication types

MeSH terms

Supplementary concepts

Associated data