. 2016 Jan 15:291:13-20.
doi: 10.1016/j.taap.2015.11.017. Epub 2015 Nov 25.

Inhibition of poly(ADP-ribose)polymerase-1 and DNA repair by uranium

Affiliations

Inhibition of poly(ADP-ribose)polymerase-1 and DNA repair by uranium

Karen L Cooper et al. Toxicol Appl Pharmacol. .

Abstract

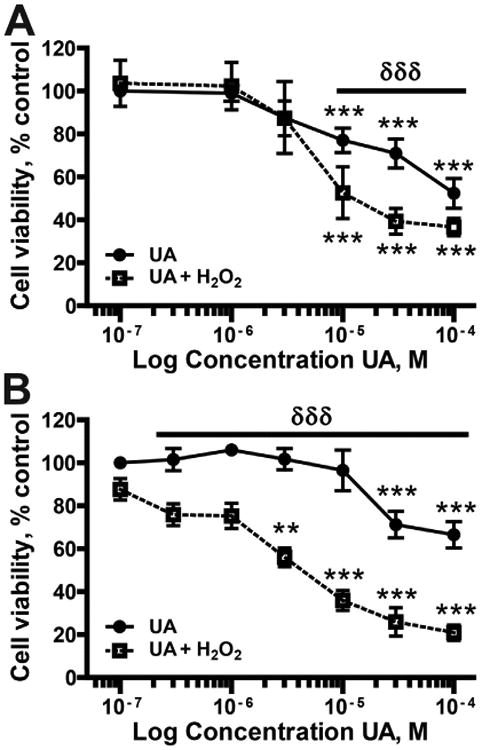
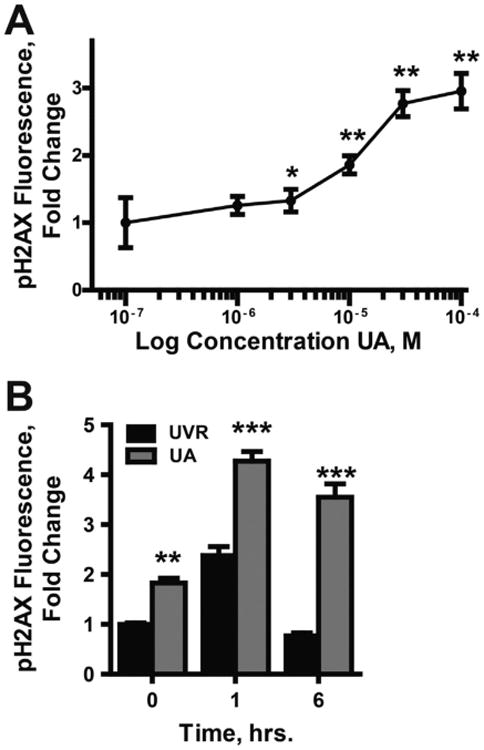
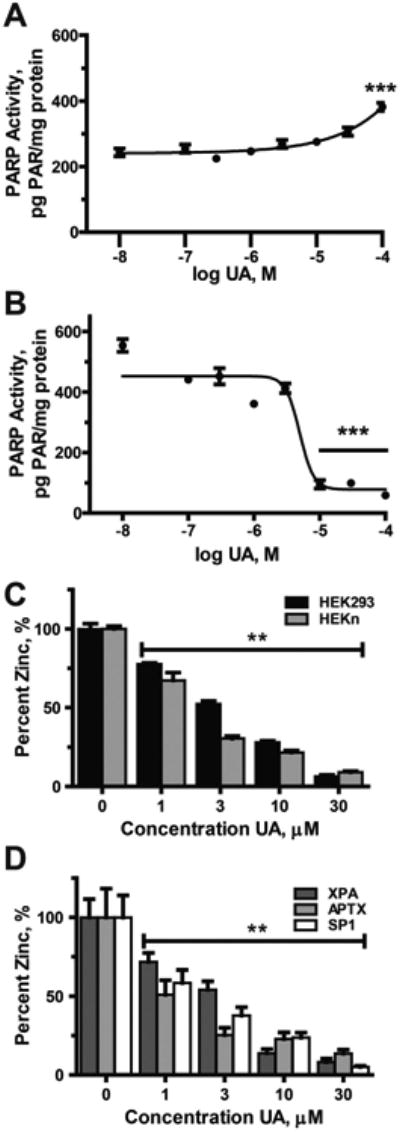
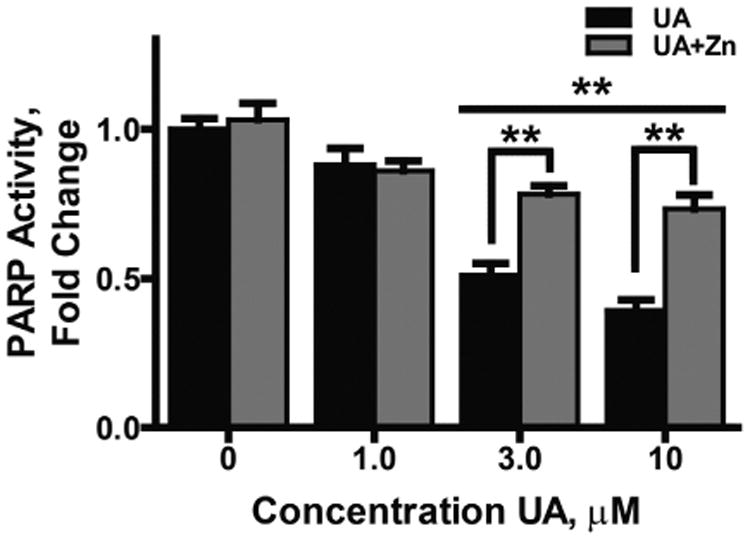
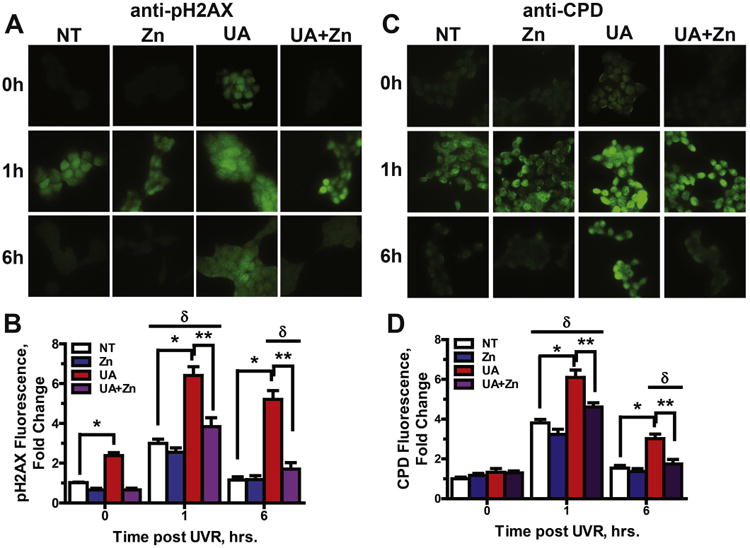
Uranium has radiological and non-radiological effects within biological systems and there is increasing evidence for genotoxic and carcinogenic properties attributable to uranium through its heavy metal properties. In this study, we report that low concentrations of uranium (as uranyl acetate; <10 μM) is not cytotoxic to human embryonic kidney cells or normal human keratinocytes; however, uranium exacerbates DNA damage and cytotoxicity induced by hydrogen peroxide, suggesting that uranium may inhibit DNA repair processes. Concentrations of uranyl acetate in the low micromolar range inhibited the zinc finger DNA repair protein poly(ADP-ribose) polymerase (PARP)-1 and caused zinc loss from PARP-1 protein. Uranyl acetate exposure also led to zinc loss from the zinc finger DNA repair proteins Xeroderma Pigmentosum, Complementation Group A (XPA) and aprataxin (APTX). In keeping with the observed inhibition of zinc finger function of DNA repair proteins, exposure to uranyl acetate enhanced retention of induced DNA damage. Co-incubation of uranyl acetate with zinc largely overcame the impact of uranium on PARP-1 activity and DNA damage. These findings present evidence that low concentrations of uranium can inhibit DNA repair through disruption of zinc finger domains of specific target DNA repair proteins. This may provide a mechanistic basis to account for the published observations that uranium exposure is associated with DNA repair deficiency in exposed human populations.

Keywords: DNA damage; DNA repair; Poly(ADP-ribose) polymerase-1 (PARP-1); Uranium; Zinc finger.


Conflict of interest statement

Conflict of interest: The authors declare that there are no conflicts of interest.

Figures

Fig. 1
Fig. 1
Cell viability following UA exposure. (A) HEK 293 cells or (B) normal keratinocytes (HEKn) were exposed to the indicated concentrations of UA for 48 h (closed circles, solid line). H2O2 (100 μM; 10 min: closed squares, dashed line) was added to a subset of samples at 24 h post-UA treatment and incubated for an additional 24 h. Cellular viability was determined using PrestoBlue Reagent. The data are presented as the means ± SEM, n = 3–4, **p < 0.01, ***p < 0.001 significantly different from exposure matched untreated controls; δδδp < 0.001 significantly different between UA and UA + H2O2 groups.
Fig. 2
Fig. 2
Enhanced DNA damage due to UA exposure. (A) HEK293 cells were treated with increasing concentrations of UA (0–100 μM) for 24 h. DNA damage was assessed via indirect immunofluorescence with anti-pH2AX antibodies. Images were collected with an Olympus IX70 equipped with a DP72 digital camera (Olympus America). Fluorescence intensity was quantified using cellSens Dimension 1.9 Count & Measure software (Olympus America). *p < 0.05, **p < 0.01 significantly different from untreated control; n = 3. (B) Cells were exposed to UA (10 μM) for 24 h then exposed to ssUVR (3 kJ/m2). Cell were fixed at zero, 1, and 6 h post-ssUVR exposure, then stained and fluorescence quantified as described in (A). Data is reported as fluorescence per nuclei normalized to the untreated control. Graphs represent a minimum of 10 images per treatment from 3 independent experiments. **p < 0.01; ***p < 0.001 significantly different from treatment matched t = 0; n = 3.
Fig. 3
Fig. 3
Inhibition of zinc finger-proteins by UA HEKn cells were treated with the indicated concentrations of UA for 24 h. A & B) Total protein was collected and PARP activity assessed via the PAR ELISA as described in “Experimental procedures”. A) PARP activity was stimulated by high concentration of UA alone. B) DNA damage-induced PARP activity (stimulated via the addition of etoposide (80 μM) for 4 h) inhibited by UA C & D). Cells were exposed to UA (0–30 μM) for 24 h. PARP-1 was immunoprecipitated from 500 μg of whole cell extract and zinc content of the protein determined via the Zinc Release Assay as described in “Experimental procedures”. C) UA induces loss of zinc from PARP-1 in both HEK293 (black bars) and HEKn (gray bars). D) Zinc assessment of immunoprecipitated XPA (dark gray bars), APTX (light gray bars) and SP1 (white bars) from HEKn cells. Graphs represent normalized means ± SEM of at least 3 independent experiments. **p < 0.01, ***p < 0.001 significantly different from untreated control.
Fig. 4
Fig. 4
Supplemental zinc is protective for UA inhibition of PARP1 activity. HEKn cells were treated with increasing concentrations of UA (0–10 μM) or UA plus Zn (2 μM) for 24 h. A) PARP activity was stimulated by inducing DNA damage via the addition of etoposide (80 μM) for 4 h. Total protein was collected and PARP activity assessed via the PAR ELISA as described in “Experimental procedures.” Data was normalized to the untreated control and graph represents mean ± SEM of at least 3 independent experiments. **p<0.01; n = 3.
Fig. 5
Fig. 5
Retention of DNA damage following UA exposure is rescued by zinc. Immunocytochemistry of HEK293 cells was used to illustrate oxidative (A, pH2AX) and direct (B, CPDs) DNA damage. Cells were cultured on chamber slides and treated with UA (10 μM), Zn(2 μM), both or neither for 24 h then DNA damage was induced by exposure to ssUVR (3 kJ/m2). Cells were fixed at 0,1 and 6 h post-ssUVR exposure and stained for the DNA damage markers pH2AX (A) and CPDs (C). Images were collected with an Olympus IX70 equipped with a digital camera and fluorescence intensity was quantified using cellSens Dimension 1.9 Count & Measure software (Olympus America) and graphs shown (B, pH2AX and D, CPDs) are mean ± SEM of the intensity per nuclei of at least 10 images from each treatment group from 3 independent experiments. *p < 0.05; **p < 0.01 significantly different from indicated groups; δp < 0.01 significantly different from treatment matched t = 0 group.

References

    1. Au WW, Lane RG, Legator MS, Whorton EB, Wilkinson GS, Gabehart GJ. Biomarker monitoring of a population residing near uranium mining activities. Environ Health Perspect. 1995;103:466–470. - PMC - PubMed
    1. Au WW, McConnell MA, Wilkinson GS, Ramanujam VM, Alcock N. Population monitoring: experience with residents exposed to uranium mining/milling waste. Mutat Res. 1998;405:237–245. - PubMed
    1. Au WW, Giri AK, Ruchirawat M. Challenge assay: a functional biomarker for exposure-induced DNA repair deficiency and for risk of cancer. Int J Hyg Environ Health. 2010;213:32–39. - PubMed
    1. Bal W, Protas AM, Kasprzak KS. Genotoxicity of metal ions: chemical insights. Met Ions Life Sci. 2011;8:319–373. - PubMed
    1. Beyersmann D, Hartwig A. Carcinogenic metal compounds: recent insight into molecular and cellular mechanisms. Arch Toxicol. 2008;82:493–512. - PubMed

Publication types

MeSH terms

Substances