. 2015 Dec 15;75(24):5341-54.
doi: 10.1158/0008-5472.CAN-15-1654. Epub 2015 Dec 1.

Identification of Variant-Specific Functions of PIK3CA by Rapid Phenotyping of Rare Mutations

Affiliations

Identification of Variant-Specific Functions of PIK3CA by Rapid Phenotyping of Rare Mutations

Turgut Dogruluk et al. Cancer Res. .

Abstract

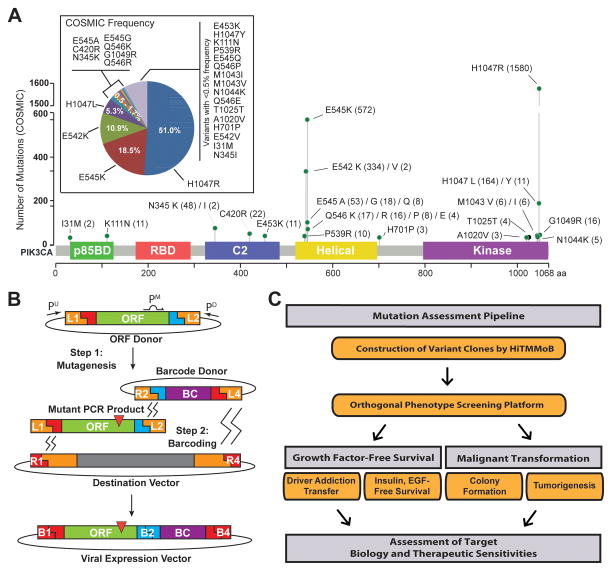
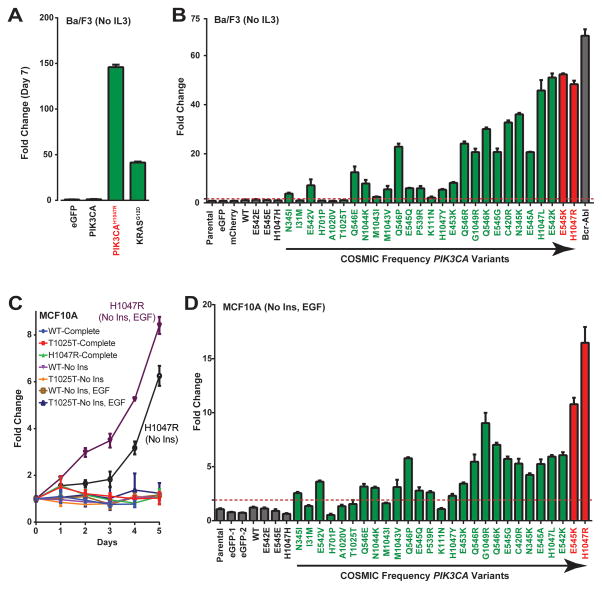
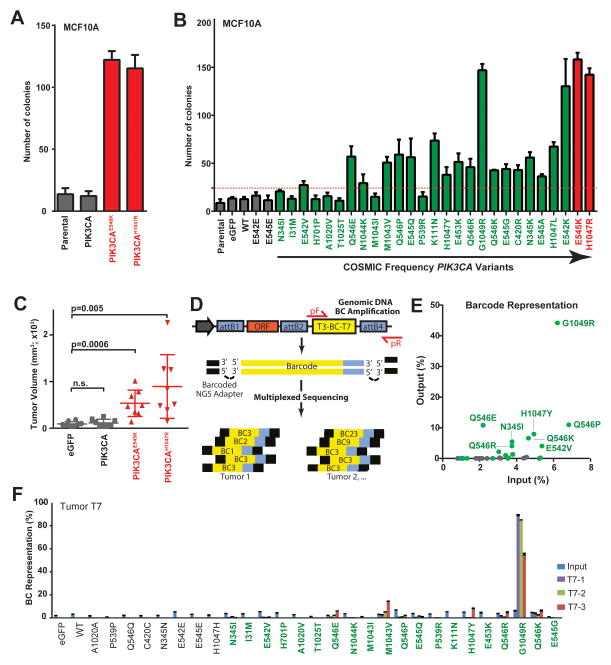
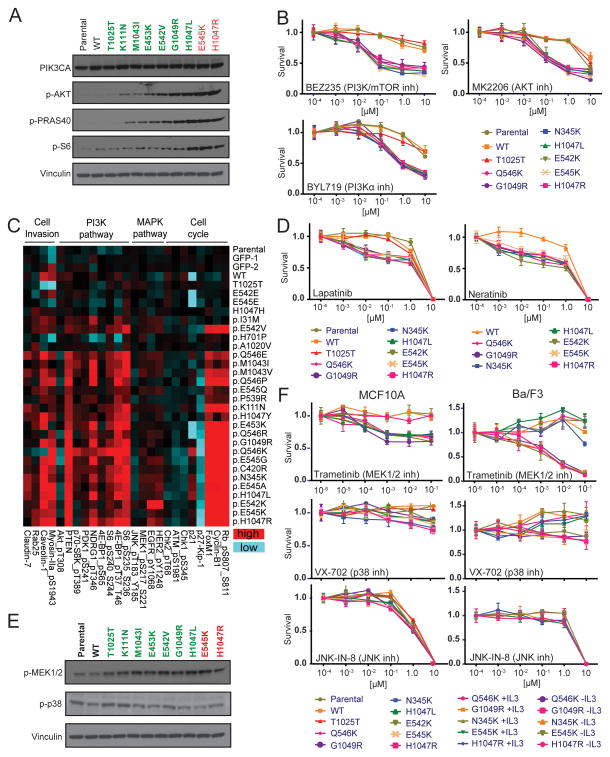
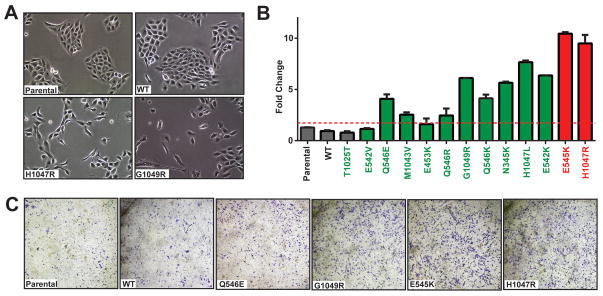
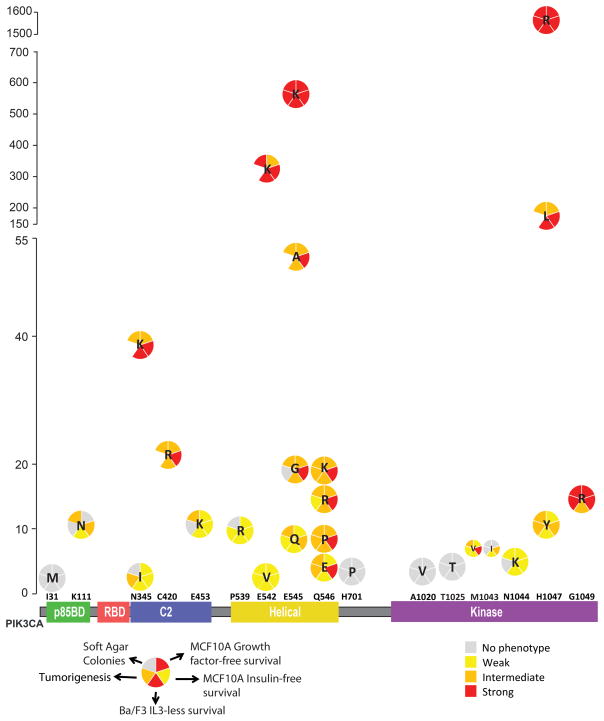
Large-scale sequencing efforts are uncovering the complexity of cancer genomes, which are composed of causal "driver" mutations that promote tumor progression along with many more pathologically neutral "passenger" events. The majority of mutations, both in known cancer drivers and uncharacterized genes, are generally of low occurrence, highlighting the need to functionally annotate the long tail of infrequent mutations present in heterogeneous cancers. Here we describe a mutation assessment pipeline enabled by high-throughput engineering of molecularly barcoded gene variant expression clones identified by tumor sequencing. We first used this platform to functionally assess tail mutations observed in PIK3CA, which encodes the catalytic subunit alpha of the phosphatidylinositol-4,5-bisphosphate 3-kinase (PI3K) frequently mutated in cancer. Orthogonal screening for PIK3CA variant activity using in vitro and in vivo cell growth and transformation assays differentiated driver from passenger mutations, revealing that PIK3CA variant activity correlates imperfectly with its mutation frequency across breast cancer populations. Although PIK3CA mutations with frequencies above 5% were significantly more oncogenic than wild-type in all assays, mutations occurring at 0.07% to 5.0% included those with and without oncogenic activities that ranged from weak to strong in at least one assay. Proteomic profiling coupled with therapeutic sensitivity assays on PIK3CA variant-expressing cell models revealed variant-specific activation of PI3K signaling as well as other pathways that include the MEK1/2 module of mitogen-activated protein kinase pathway. Our data indicate that cancer treatments will need to increasingly consider the functional relevance of specific mutations in driver genes rather than considering all mutations in drivers as equivalent.


Conflict of interest statement

Disclosure of potential conflicts of interest: No potential conflicts of interest were disclosed.

Figures

Figure 1
Figure 1. PIK3CA variant selection and mutation assessment platform
(A) COSMIC PIK3CA variant frequencies and distribution across domain-annotated p110α protein structure for mutations chosen for modeling and functional annotation. Number in parentheses indicates numbers of samples found mutant in COSMIC. (B) Illustration of HiTMMoB-mediated mutagenesis and molecular barcoding using megaprimer PCR and multi-fragment recombination. Recombination of mutant PCR product and barcode into destination vector denoted by zig-zag lines. ORF = open reading frame clone; BC = Barcode; Pu/Pm/PD, PCR primers; L/R/B, att recombination sequences; red triangle = mutation. See Methods for details. (C) Illustration of mutation assessment pipeline workflow.
Figure 2
Figure 2. PIK3CA tail mutations promote growth factor-free survival
(A–B) Ba/F3 cell survival in the absence of IL3 for (A) the indicated controls and (B) the expanded series of negative controls (gray), rare (green) and hotspot (red) PIK3CA variants. Bcr-Abl = positive control for Ba/F3 assay. (C) Growth curve for MCF10A cells expressing wild-type (WT) or the indicated PIK3CA variants (PIK3CAH1047 and PIK3CAT1025T) in the presence or absence of growth factors insulin (Ins) and EGF. Complete = growth factor-complete medium. (D) MCF10A cell lines expressing the indicated PIK3CA variants assessed for cell growth in the absence of insulin and EGF. All data in B and D normalized to the mean of the negative controls. Dashed line = significance limit set as value equal to 3x standard deviations of negative control values. Data normalized to the average of negative controls. Error bars depict standard deviation.
Figure 3
Figure 3. PIK3CA tail mutations promote in vitro cell transformation and oncogenic tumor growth (A–B)
MCF10A anchorage-independent colony formation assays for (A) the indicated controls and (B) the expanded series of negative controls (gray), rare (green) and hotspot (red) PIK3CA variants. Dashed line = significance limit set as value equal to 3x standard deviations of negative control values. Data normalized to the average of negative controls. (C) Endpoint volumes (day 36 post-injection) for xenograft tumors resulting from HMLER cells expressing control (eGFP and wild-type PIK3CA; gray) and hotspot variants (PIK3CAE545K and PIK3CAH1047, red). P-value calculated by t-test; n.s. = not significant. (D) Illustration of barcode design and NGS sequencing strategy. Large arrow, vector promoter; pF/pR = forward and reverse PCR amplicon primers; ORF = open reading frame clone; BC = Barcode; attB1/2/4, recombination sequences. See Methods for details. (E) Two-dimension dot plot indicating the ratio of barcode reads for each negative control (gray) and rare (green) variant barcode in injected cells (Input, X-axis) in all tumor samples (Y-axis) to total number of barcode reads. (F) Barcode enrichment analysis of representative tumor, T7. Error bars represent ratio of number of barcode reads for mutations to total number of barcode reads from 3 (T7-1, 2, 3) cores of a single experimental tumor, T7. Error bars depict standard deviation of sequencing amplicon replicates.
Figure 4
Figure 4. PIK3CA tail mutations differentially activate cancer signaling pathways and sensitize cells to pathway inhibitors
(A) Immunoblot analysis of the indicated proteins using extracts from MCF10A cells expressing wild-type (WT), rare (green) and hotspot (red) PIK3CA variants grown in the absence of insulin and EGF. Vinculin = loading control. (B) Dose-response survival curves for the indicated MCF10A stable cell lines treated with PI3K pathway inhibitors BEZ235, MK2206 and BYL719. (C) Representative differentially expressed proteins (p<0.05) determined by RPPA, respectively, from the indicated stable MCF10A cell lines grown in the absence of insulin and EGF. Entire RPPA dataset (p<0.05) provided in Supplementary Figure S2. (D) Dose-response survival curves for the indicated MCF10A stable cell lines treated with HER2/EGFR inhibitors Lapatinib and Neratinib. (E) Immunoblot analysis of the indicated proteins using extracts from MCF10A cells expressing wild-type (WT), rare (green) and hotspot (red) PIK3CA variants grown in the absence of insulin and EGF. Vinculin = loading control. (F) Dose-response survival curves for the indicated MCF10A (left) and Ba/F3 (right) stable cell lines treated with inhibitors BEZ235, MK2206 and BYL719. For Ba/F3, the sensitivity exhibited by experimental cell lines (-IL3) is assessed by comparison with cell lines re-addicted to IL3 (+IL3) over PIK3CA variants. Error bars depict the standard deviation.
Figure 5
Figure 5. Oncogenic PIK3CA variants induce invasive phenotypes in breast epithelial cells
(A) Representative images of parental MCF10A cells and those expressing wild-type (WT) or the indicated PIK3CA variants (PIK3CAH1047 and PIK3CAG1049R). (B) MCF10A cells expressing the indicated controls, wild-type (WT), low-frequency (green) and hotspot (red) PIK3CA variants were applied to transwell Matrigel invasion chambers, followed by quantitation of invaded cells. Error bars depict the standard deviation. (C) Representative images from bottoms of cell invasion chambers from (B) following staining with crystal violet.
Figure 6
Figure 6. PIK3CA tail mutation activity summary
X-axis represents the domain structure of PIK3CA protein (p110alpha) with analyzed mutations depicted (x-axis is not to scale). Y-axis represents the occurrence of each mutation based on COSMIC analysis. Relative strength of phenotype for each assay is based on as follows: Ba/F3: Weak=2–15 fold, Intermediate=15–35 fold, Strong>35 fold; Growth factor-free proliferation: Weak=2–4 fold, Intermediate=4–9 fold, Strong>9 fold; No Insulin proliferation: Weak=1.3–2.5 fold, Intermediate=2.5–4 fold, Strong>4 fold and above; Colony formation: Weak=25–35 colonies, Intermediate=35–65 colonies, Strong=>65 colonies; Tumorigenesis: Weak=1–5% representation, Intermediate=5–10% representation, Strong>10% representation.

References

    1. Kandoth C, McLellan MD, Vandin F, Ye K, Niu B, Lu C, et al. Mutational landscape and significance across 12 major cancer types. Nature. 2013;502(7471):333–9. - PMC - PubMed
    1. TCGA. Comprehensive molecular portraits of human breast tumours. Nature. 2012;490(7418):61–70. - PMC - PubMed
    1. Hoadley KA, Yau C, Wolf DM, Cherniack AD, Tamborero D, Ng S, et al. Multiplatform analysis of 12 cancer types reveals molecular classification within and across tissues of origin. Cell. 2014;158(4):929–44. - PMC - PubMed
    1. Samuels Y, Diaz LA, Jr, Schmidt-Kittler O, Cummins JM, Delong L, Cheong I, et al. Mutant PIK3CA promotes cell growth and invasion of human cancer cells. Cancer Cell. 2005;7(6):561–73. - PubMed
    1. Isakoff SJ, Engelman JA, Irie HY, Luo J, Brachmann SM, Pearline RV, et al. Breast cancer-associated PIK3CA mutations are oncogenic in mammary epithelial cells. Cancer Res. 2005;65(23):10992–1000. - PubMed

Publication types

Substances