. 2015 Dec 1;112(48):E6614-23.
doi: 10.1073/pnas.1515733112. Epub 2015 Nov 16.

Mitochondrial functions modulate neuroendocrine, metabolic, inflammatory, and transcriptional responses to acute psychological stress

Affiliations

Mitochondrial functions modulate neuroendocrine, metabolic, inflammatory, and transcriptional responses to acute psychological stress

Martin Picard et al. Proc Natl Acad Sci U S A. .

Abstract

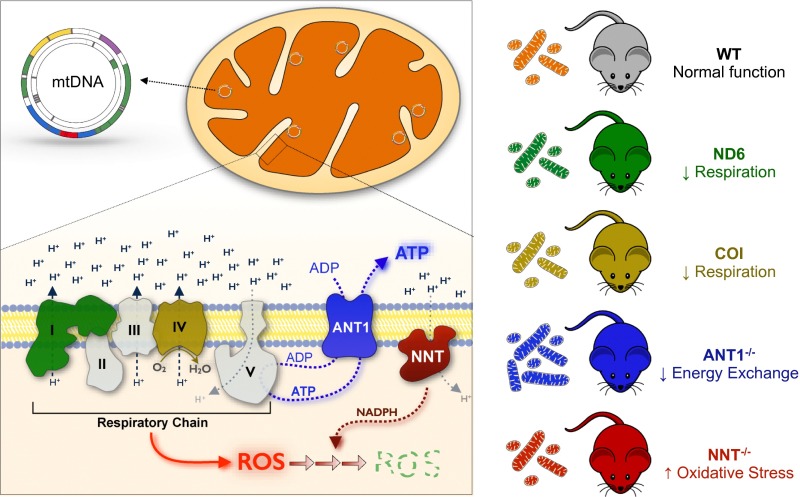
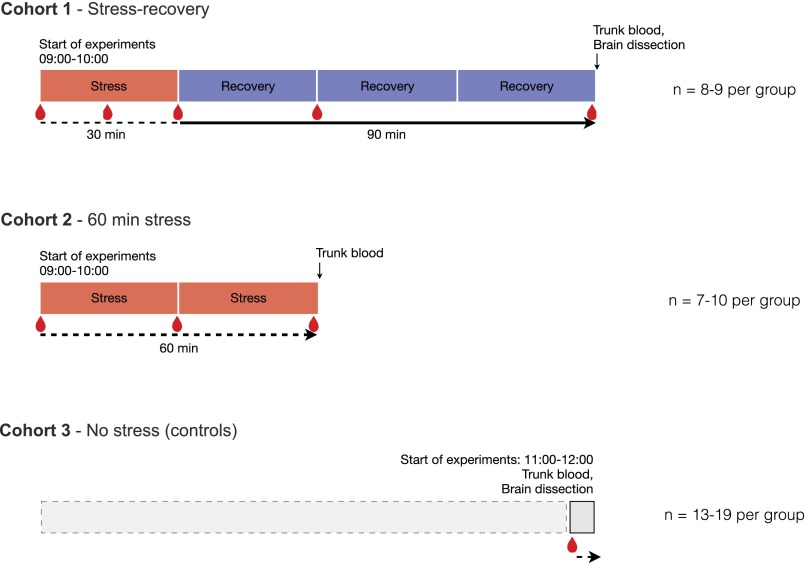
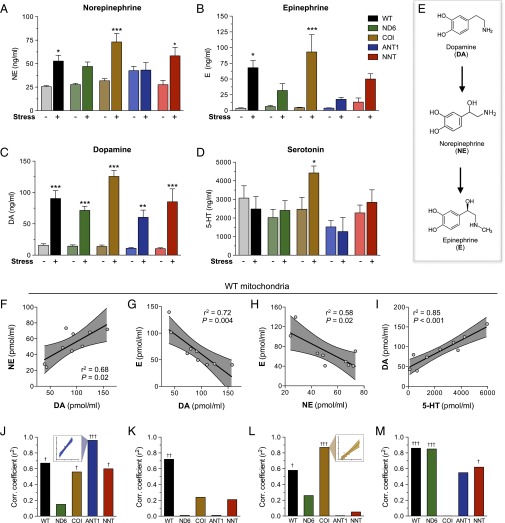
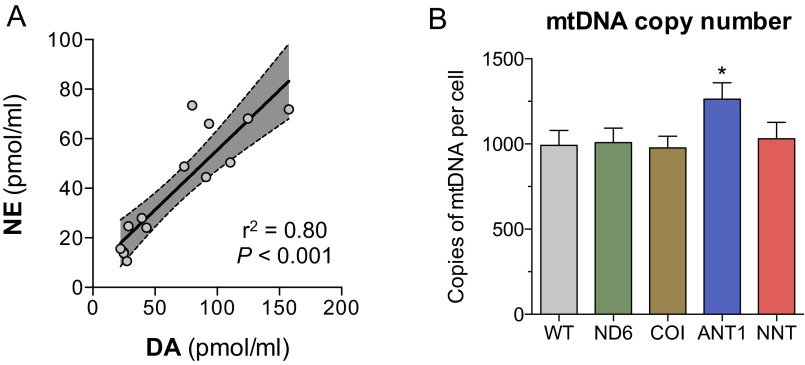
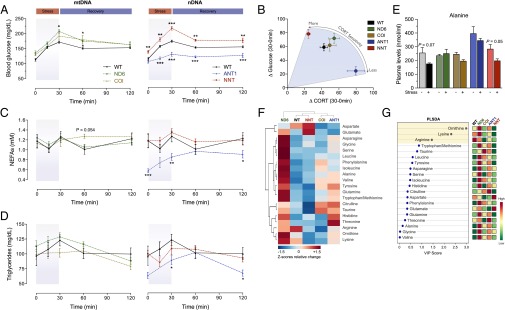
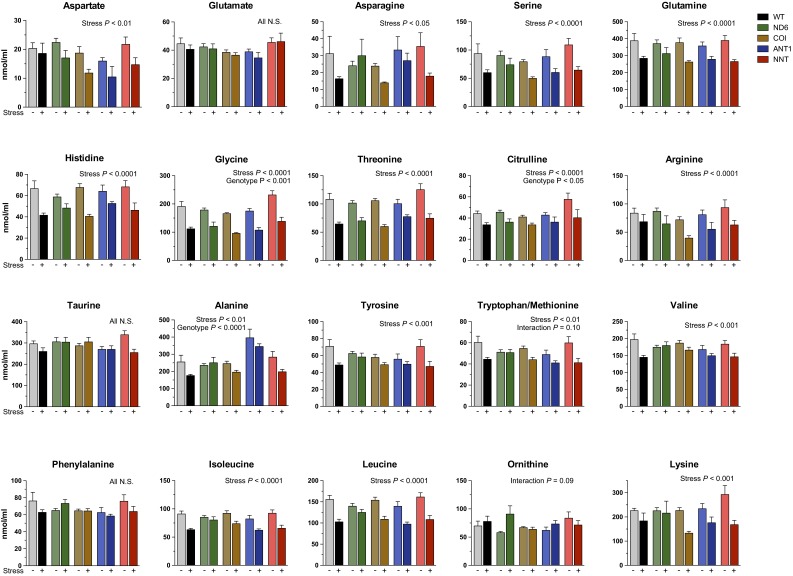
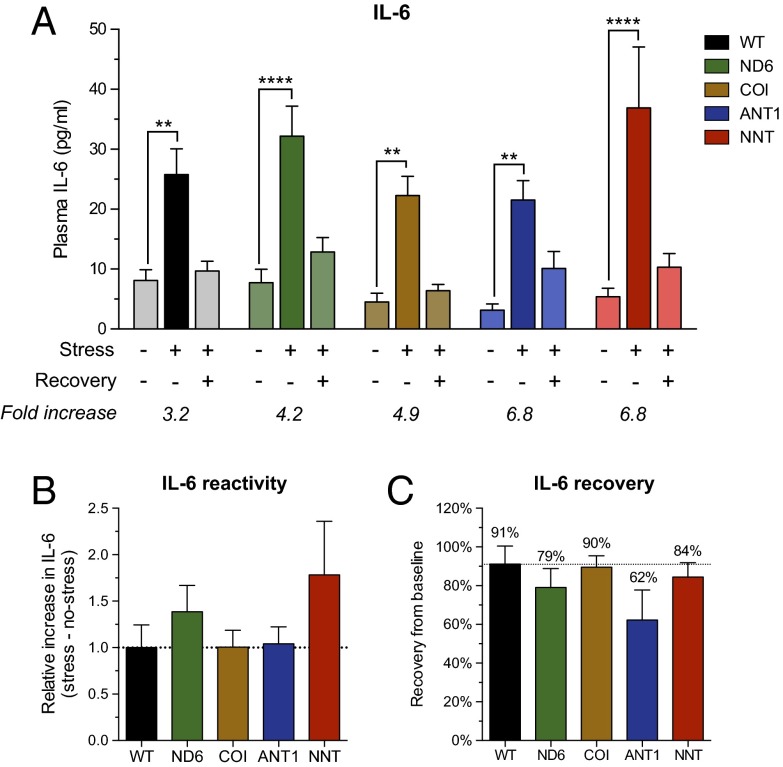
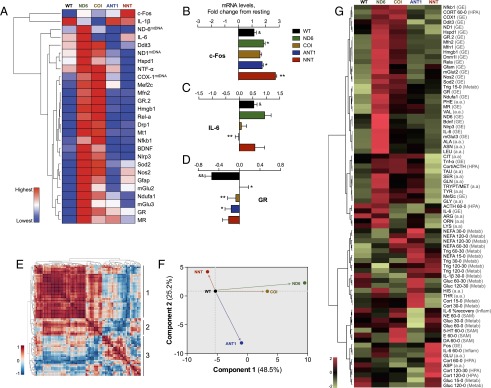
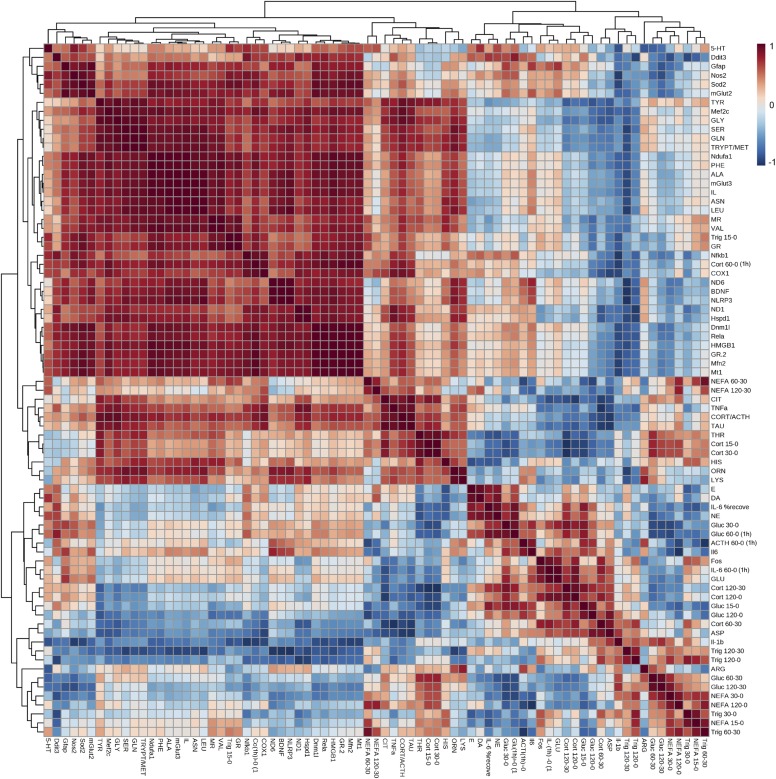
The experience of psychological stress triggers neuroendocrine, inflammatory, metabolic, and transcriptional perturbations that ultimately predispose to disease. However, the subcellular determinants of this integrated, multisystemic stress response have not been defined. Central to stress adaptation is cellular energetics, involving mitochondrial energy production and oxidative stress. We therefore hypothesized that abnormal mitochondrial functions would differentially modulate the organism's multisystemic response to psychological stress. By mutating or deleting mitochondrial genes encoded in the mtDNA [NADH dehydrogenase 6 (ND6) and cytochrome c oxidase subunit I (COI)] or nuclear DNA [adenine nucleotide translocator 1 (ANT1) and nicotinamide nucleotide transhydrogenase (NNT)], we selectively impaired mitochondrial respiratory chain function, energy exchange, and mitochondrial redox balance in mice. The resulting impact on physiological reactivity and recovery from restraint stress were then characterized. We show that mitochondrial dysfunctions altered the hypothalamic-pituitary-adrenal axis, sympathetic adrenal-medullary activation and catecholamine levels, the inflammatory cytokine IL-6, circulating metabolites, and hippocampal gene expression responses to stress. Each mitochondrial defect generated a distinct whole-body stress-response signature. These results demonstrate the role of mitochondrial energetics and redox balance as modulators of key pathophysiological perturbations previously linked to disease. This work establishes mitochondria as stress-response modulators, with implications for understanding the mechanisms of stress pathophysiology and mitochondrial diseases.

Keywords: HPA axis; catecholamines; hippocampus; mitochondria; stress reactivity.


Conflict of interest statement

The authors declare no conflict of interest.

Figures

Fig. 1.
Fig. 1.
Mouse models of mitochondrial dysfunction. Mice with normal mitochondria (WT) are compared with mice with mtDNA mutations in genes encoding ND6 and COI, decreasing electron transport chain and respiratory capacity. ANT1−/− animals have impaired ATP/ADP transport across the inner mitochondrial membrane, and NNT−/− animals are deficient in a major intramitochondrial antioxidant system. (Mouse cartoons were adapted from clker.com.)
Fig. S1.
Fig. S1.
Study design. Shown is the experimental time course, with sequential blood collection from the tail (cohort 1), the 60-min continuous stress paradigm (cohort 2), and the no-stress control animals (cohort 3) used in this study.
Fig. 2.
Fig. 2.
Mitochondrial defects modify HPA axis function. (A) Plasma CORT levels during 30 min of restraint stress followed by 90 min of recovery in mice with normal mitochondria (WT), mtDNA mutations in ND6 and COI genes (Left), and nDNA deletions of ANT1 and NNT genes (Right) (n = 8–9; two-way ANOVA, Holm–Sidak’s multiple comparisons vs. WT, *P < 0.01, **P < 0.01, ***P < 0.001). (B) Plasma levels of CORT and ACTH after 60-min restraint stress. Note that NNT-deficient animals have the lowest CORT levels with the highest ACTH (n = 7–10; one-way ANOVA, P < 0.001 and 0.02; Holm–Sidak’s multiple comparisons vs. WT, *P < 0.05). (C) CORT/ACTH ratio at 60 min (n = 7–10; one-way ANOVA, P < 0.001; Holm–Sidak’s multiple comparisons vs. WT, *P < 0.05). Data are shown as means ± SEM.
Fig. 3.
Fig. 3.
Mitochondrial defects modulate SAM axis function and biogenic amines levels. (AD) Plasma levels of NE (A), E (B), DA (C), and 5-HT (D) in nonstressed and stressed WT and ND6-, COI-, ANT1-, and NNT-deficient mice. Data are shown as means ± SEM; n = 4–10, two-way ANOVAs, P < 0.0001 for AC, and P = 0.26 for D. Holm–Sidak’s multiple comparisons vs. no stress, *P < 0.05, **P < 0.01, ***P < 0.001. (E) Sequential biochemical transformation of DA, NE, and E. (FI) Linear regressions and 95% confidence intervals (dotted lines) for correlations between circulating biogenic amine levels in stressed WT mice. (JM) corresponding Pearson correlation coefficients (r2) for all genotypes (n = 7–10; correlation coefficients, P < 0.05, ††P < 0.01, †††P < 0.001).
Fig. S2.
Fig. S2.
Biogenic amine metabolism and hippocampal mtDNA copy number. (A) Linear regression (Pearson’s method) and 95% confidence intervals (dotted lines) between circulating DA and NE levels in both nonstressed (resting) and stressed WT animals. (B) mtDNA copy number in the left hippocampus (n = 16–19; one-way ANOVA, P = 0.12; two-tailed student’s t-test vs. WT, *P < 0.05). Data are shown as means ± SEM.
Fig. 4.
Fig. 4.
Mitochondrial defects modulate stress-induced metabolic perturbations. (A) Blood glucose levels during stress and recovery in mice with WT mitochondria, ND6- or COI-deficiency (mtDNA mutations), and ANT1- or NNT-deficiency (nDNA deletions) (n = 8–9; two-way ANOVA, P < 0.001, Holm–Sidak’s multiple comparisons). (B) Glucose-related CORT sensitivity plot showing means and SEMs for ΔCORT and Δglucose between 0 and 30 min of restraint stress. (C) Plasma levels of NEFAs (n = 7–9; two-way ANOVA, P = 0.054 (mtDNA) and P < 0.001 (nDNA), Holm–Sidak’s multiple comparisons). (D) Plasma levels of triglycerides (n = 9–15; two-way ANOVA two-tailed student’s t-tests; N.S., non significant). (E) Plasma concentration of alanine in unstressed mice and after 60-min restraint (two-way ANOVA; main effect of stress P < 0.01 and genotype P < 0.0001 with Fisher’s least significant difference test). See Fig. S3 for data on all amino acids. (F) Heatmap of relative normalized changes (stress–resting) in amino acid levels across genotypes, with dendrograms illustrating hierarchical clustering of pattern similarity across metabolites (Left) and genotypes (Top). (G) PLSDA of the change in stress–resting amino acid levels, sorted by variable importance in projection (VIP) scores for the first component (66% of explained variance). Data are shown as means ± SEM, *P < 0.05, **P < 0.01, ***P < 0.001.
Fig. S3.
Fig. S3.
Circulating levels of amino acids in mice under resting conditions and after 60 min of restraint stress. The circulating concentration (in nanomoles per milliliter) of each amino acid is shown. P values are from two-way ANOVAs, indicating main effects of stress, genotype, or stress × genotype interaction. Data are shown as means ± SEM.
Fig. 5.
Fig. 5.
Mitochondrial defects alter IL-6 levels. (A) Circulating IL-6 levels measured in nonstressed mice, restraint, and restraint + recovery (n = 8–9; two-way ANOVA P < 0.001, Holm–Sidak’s multiple comparisons). (B and C) Calculated relative increase in IL-6 concentration from baseline (B) and efficiency of shut-down of IL-6 during recovery calculated as % recovery (C). Data are shown as means ± SEM; **P < 0.01, ****P < 0.0001.
Fig. 6.
Fig. 6.
Mitochondrial functions modulate stress-induced changes in gene expression and systemic response signatures. (A) Hierarchical clustering heatmap of relative changes in hippocampal gene expression. The dendrogram on the left indicates the degree of correlation (Pearson’s) between genes across genotypes. (BD) Fold change in c-Fos (B), IL-6 (C), and GR gene expression (D) in response to restraint stress (two-tailed student’s t-test, n = 5–8; data are shown as means ± SEM. &P < 0.05, &&P < 0.01 vs. resting; *P < 0.5, **P < 0.01 vs. WT). (E) Pearson correlation matrix for all measured stress-induced changes (stress–resting) across genotypes; for details of variables, see Fig. S5. (F) PCA of the data shown in E, demonstrating unique gene-expression signatures for each mitochondrial genotype. (G) Heatmap and hierarchical clustering of all 77 studied stress-response parameters illustrating variables accounting for divergent stress-response signatures between mitochondrial genotypes. Variables include gene expression (GE), amino acids (a.a.), metabolic (metab), HPA axis (HPA), SAM axis/biogenic amines (SAM), inflammatory (Inflam).
Fig. S4.
Fig. S4.
Change in hippocampal gene expression in stressed vs. resting mice. Differences in in mRNA transcript levels relative to resting (no-stress) WT mice are shown for ND6 and COI mtDNA mutants and for mice with ANT1 and NNT nDNA deletions. Genes are grouped based on their known function in brain remodeling and synaptic function (A and B), neuroinflammation (C and D), endogenous inflammation (E), mitochondrial electron transport chain (F), mitochondrial stress response (G), and mitochondrial dynamics (H). Two-tailed student’s t-test; n = 5–8 per group; &P < 0.05, &&P < 0.01 vs. resting WT; *P < 0.05, **P < 0.01 vs. WT. Data are shown as means ± SEM.
Fig. S5.
Fig. S5.
Correlation matrix of stress–resting differences for all parameters investigated across genotypes. Pearson correlation coefficients (color-coded) between all study variables, including neuroendocrine, metabolic, inflammatory, and transcriptional measures. Cort, corticosterone; DA, dopamine; E, epinephrine; Gluc, glucose; Gluc 30–0, difference in circulating glucose concentration between the end of restraint stress (30 min) and resting (0 min); NE, norepinephrine; NEFA, nonesterified fatty acids; Trig, triglycerides; 5-HT, serotonin. See the legend of Table S1 for abbreviations of genes. Amino acids are abbreviated with the standard universal three-letter code. Variables marked “(1h)” were measured in cohort 2 (1 h continuous restraint stress).
Fig. S6.
Fig. S6.
Experimental design and restraint stress. (A) Detailed experimental schedule. Time is expressed in in minutes. (BD) Ventilated conical tubes (B and C) and animal dividers (D) used for restraint stress.
Fig. S7.
Fig. S7.
RNA processing workflow and quality control. (A) RNA extraction workflow from the right hippocampus. (B) Detection of contaminating mtDNA (mitochondrial ND1 gene) and nDNA (B2M nuclear DNA gene) from RNA preparations. Listed are Ct values before and after DNase treatment indicating efficient removal of both mtDNA and nDNA below the threshold for gene-expression assays. Note the high abundance of mtDNA copies before DNase treatment, underscoring the importance of enzymatic DNA removal for gene-expression analysis of mtDNA-encoded transcripts. NTC, no-template control. (C) RNA integrity number (RIN) measured on the Bioanalyzer in DNase-treated and nontreated samples. DNase treatment did not affect RNA integrity.
Fig. S8.
Fig. S8.
Effect of time and handling stress on hippocampal gene expression in control (nonstressed) mice of different mitochondrial genotypes. Transcript levels for Fos (c-Fos) (A), glucocorticoid receptor (GR) (B), and the myocyte enhancing factor 2c (Mef2c) (C). n = 1–3 mice per time point; data are shown as means ± SEM where the number of mice >1. Values are shown relative to the first mouse of each cage used for analyses at 3 min after cage displacement, which is the time required for tail bleed and euthanizing of each mouse. Subsequent mice are processed at 6, 9, and 12 min. Note the resulting rapid consistent effect on gene expression for the stress-response gene Fos, but not for GR and Mef2c, demonstrating the sensitive nature of certain transcriptional responses and the importance of controlling handling time before euthanizing in study design.

References

    1. McEwen BS. Stress, adaptation, and disease. Allostasis and allostatic load. Ann N Y Acad Sci. 1998;840:33–44. - PubMed
    1. Cohen S, Janicki-Deverts D, Miller GE. Psychological stress and disease. JAMA. 2007;298(14):1685–1687. - PubMed
    1. McEwen BS. Physiology and neurobiology of stress and adaptation: Central role of the brain. Physiol Rev. 2007;87(3):873–904. - PubMed
    1. Lundberg U. Stress hormones in health and illness: The roles of work and gender. Psychoneuroendocrinology. 2005;30(10):1017–1021. - PubMed
    1. Rohleder N. Stimulation of systemic low-grade inflammation by psychosocial stress. Psychosom Med. 2014;76(3):181–189. - PubMed

Publication types

MeSH terms

LinkOut - more resources