. 2015 Dec 1;112(48):E6691-8.
doi: 10.1073/pnas.1519807112. Epub 2015 Nov 16.

Shifting eating to the circadian rest phase misaligns the peripheral clocks with the master SCN clock and leads to a metabolic syndrome

Affiliations

Shifting eating to the circadian rest phase misaligns the peripheral clocks with the master SCN clock and leads to a metabolic syndrome

Atish Mukherji et al. Proc Natl Acad Sci U S A. .

Abstract

The light-entrained master central circadian clock (CC) located in the suprachiasmatic nucleus (SCN) not only controls the diurnal alternance of the active phase (the light period of the human light-dark cycle, but the mouse dark period) and the rest phase (the human dark period, but the mouse light period), but also synchronizes the ubiquitous peripheral CCs (PCCs) with these phases to maintain homeostasis. We recently elucidated in mice the molecular signals through which metabolic alterations induced on an unusual feeding schedule, taking place during the rest phase [i.e., restricted feeding (RF)], creates a 12-h PCC shift. Importantly, a previous study showed that the SCN CC is unaltered during RF, which creates a misalignment between the RF-shifted PCCs and the SCN CC-controlled phases of activity and rest. However, the molecular basis of SCN CC insensitivity to RF and its possible pathological consequences are mostly unknown. Here we deciphered, at the molecular level, how RF creates this misalignment. We demonstrate that the PPARα and glucagon receptors, the two instrumental transducers in the RF-induced shift of PCCs, are not expressed in the SCN, thereby preventing on RF a shift of the master SCN CC and creating the misalignment. Most importantly, this RF-induced misalignment leads to a misexpression (with respect to their normal physiological phase of expression) of numerous CC-controlled homeostatic genes, which in the long term generates in RF mice a number of metabolic pathologies including diabetes, obesity, and metabolic syndrome, which have been reported in humans engaged in shift work schedules.

Keywords: circadian clocks misalignment; diabetes; metabolic syndrome; mouse; shift work.


Conflict of interest statement

The authors declare no conflict of interest.

Figures

Fig. 1.
Fig. 1.
GSK3β-dependent RevErbα phosphorylation is critical for maintaining the RF-induced CC shift. (A) Levels of blood components in control, RF15 mice, and in mice after 2 and 4 d of reversal of RF (RRF2 and RRF4). (B) ChIP-qPCR assays in liver to analyze the RevErbα and the Bmal1 recruitment to their respective DBSs in the genes as indicated. (C) RNA transcript levels of CC components in liver of control, RF15, RRF2, and RRF4 mice. (D) RNA transcript levels of genes, as indicated, in the liver of control, RF15, RRF2, and RRF4 mice. (E) Immunoblot analyses, at ZT0, of control, RF15, RRF2, and RRF4 livers with indicated antibodies. (F) A schematic representation of how RF-induced PCCs shift is maintained. (G) A schematic representation of how restoration of insulin signaling leads to the reversal of RF-induced PCCs shift. (H) RNA transcript levels of CC components in liver of control, RF15, and RF15+ARA mice. (I) RNA transcript levels of CC components in IEC of control, RF15, and RF15+ARA mice. All values are mean ± SEM. *P < 0.05, **P < 0.01.
Fig. S1.
Fig. S1.
RF-induced increase in GSK3β activity plays a critical role in maintaining the peripheral CCs shift. (A and B) RNA transcript levels of genes, as indicated, in liver (A) and IECs (B) of control, RF15, and reversal of RF (RRF; RRF2 and RRF4) mice. (C and D) RNA transcript levels of CC components genes in IECs (C) and pancreas (D) of control, RF15, RRF2, and RRF4 mice. (E) ChIP-qPCR analysis of RevErbα recruitment to RORE DBSs present in genes, as indicated, in liver of RF mice, with or without i.p. administration of the GSK3β inhibitor ARA. (F) ChIP-qPCR analysis of Bmal1 recruitment to E-box DBS present in genes, as indicated, in liver of RF mice, with or without i.p. administration of the GSK3β inhibitor ARA. (G) ChIP-qPCR analysis of RevErbα recruitment to RORE DBSs present in genes, as indicated, in IECs of RF mice, with or without i.p. administration of the GSK3β inhibitor ARA. (H) ChIP-qPCR analysis of Bmal1 recruitment to E-box DBS present in genes, as indicated, in IECs of RF mice, with or without i.p. administration of the GSK3β inhibitor ARA. (I and J) RNA transcript levels of CC components in liver (I) and IECs (J) of RF mice with or without i.p. administration of LiCl. (K) Immunoblot analyses, at ZT0, of control and RF30 livers, with indicated antibodies. (L) Immunoblot analyses, at ZT0, of RF30 livers treated with or without i.p. administration of glucose, with indicated antibodies. (M) RNA transcript levels of CC components in the liver of control, RF30, and RF30+Glucose mice. All values are mean ± SEM.
Fig. 2.
Fig. 2.
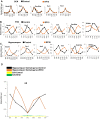
The SCN CC is insensitive to the RF-induced metabolic alterations. (A) RNA transcript levels of CC components in the SCN of control and RF30 mice. (B) RNA transcript levels of PPARα and glucagon receptors in the SCN of control and RF30 mice. Expression of these genes in liver was evaluated as a control. (C) In situ hybridization of brain sections of control and RF mice with PPARα riboprobes. RORα expression was used as a marker for localizing the SCN. (D) Actimetric analyses of the circadian locomotor activity in control and RF30 mice. All values are mean ± SEM.
Fig. S2.
Fig. S2.
The central SCN CC is unaffected by the RF. (A) RNA transcript levels of CC components in the SCN of control and RF15 mice. (B) RNA transcript levels of CC components in the PVN of control and RF15 mice. (C) RNA transcript levels of CC components genes in the hippocampus (dentate gyrus) of control and RF30 mice. (D) RNA transcript level of GR in the hippocampus (dentate gyrus) and SCN of control and RF30 mice. All values are mean ± SEM.
Fig. 3.
Fig. 3.
Prolonged feeding during the rest phase leads to the development of diabetes and fatty liver. (A) Levels of blood components, as indicated, after RF15, RF30, and RF90. (B) As in A, but measuring TG levels in liver. (C) As in A, but measuring blood levels of total, HDL, and LDL cholesterol. (D) As in A, but measuring total bile acids. (E) Oil red O staining to detect TG deposition in control and RF90 liver. (F–H) Glucose tolerance tests (GTTs) and GSIS after RF15 (F), RF30 (G), and RF90 (H). (I) RNA transcript levels of genes, as indicated, in pancreas of control and RF30 mice. (J) RNA transcript levels of genes as indicated in liver of control and RF30 mice. (K) Total body weight and weight of the peritoneal adipose tissue in control and RF mice. (L) Insulin tolerance tests (ITT) after RF15, RF30, and RF90 days. All values are mean ± SEM. *P < 0.05, **P < 0.01, ***P < 0.001.
Fig. 4.
Fig. 4.
A misalignment of PCCs with the SCN CC under RF regime progressively induces a metabolic syndrome. (A) Schematic representation of how PCCs alignment with the SCN CC maintains INS, glucose, and FFA homeostasis. (B) A schematic representation of how PCCs misalignment with the SCN CC in RF mice leads to hypoinsulinemia, hyperglycemia, and increased FFA level. (C) A schematic representation of how PCCs alignment with the SCN CC maintains lipogenesis and TG level and prevents adiposity. (D) A schematic representation of how PCCs misalignment with the SCN CC in RF mice leads to an increase in lipogenesis, hypertriglyceridemia, and adiposity.
Fig. S3.
Fig. S3.
Metabolic features of RF30 mice. (A) RNA transcript levels of genes, as indicated, in liver of control and RF30 mice. (B) RNA transcript levels of CC components in IECs of control and RF30 mice. (C) RNA transcript levels of CC components liver of control and RF30 mice. (D) RNA transcript levels of genes, as indicated, in liver of control and RF30 mice. (E) RNA transcript levels of HSD3B5 and IGFBP1 in liver of control and RF30 mice. (F) FGF21 and IGF1 levels in blood of control and RF30 mice. All values are mean ± SEM. *P < 0.05.
Fig. S4.
Fig. S4.
Progressive deterioration of metabolism on prolonged RF. (A) RNA transcript levels of CC components in liver of control and RF90 mice. (B) RNA transcript levels of genes, as indicated, in liver of control and RF90 mice. (C) The total number of pellets consumed by control and RF90 mice. (D and E) RNA transcript levels of genes, as indicated, in WAT of control and RF90 mice. All values are mean ± SEM.
Fig. 5.
Fig. 5.
Prolonged RF-induced metabolic alterations are reversible on returning to normal feeding regime. (A) RNA transcript levels of CC components in liver of control and RF90 mice, and in mice after reversal of RF (RRF7 and RRF15). (B) RNA transcript levels of genes, as indicated, in liver of control and RF90 mice, and in mice after reversal of RF (RRF7 and RRF15). (C) RNA transcript levels of genes, as indicated, in pancreas of control and RF90 mice, and in mice after reversal of RF (RRF7 and RRF15). (D) Levels of blood components, as indicated, in control and RF90 mice, and in mice after reversal of RF (RRF7 and RRF15). All values are mean ± SEM. *P < 0.05, **P < 0.01, ***P < 0.001.

Similar articles

Cited by

References

    1. Asher G, Schibler U. Crosstalk between components of circadian and metabolic cycles in mammals. Cell Metab. 2011;13(2):125–137. - PubMed
    1. Bass J, Takahashi JS. Circadian integration of metabolism and energetics. Science. 2010;330(6009):1349–1354. - PMC - PubMed
    1. Asher G, Sassone-Corsi P. Time for food: The intimate interplay between nutrition, metabolism, and the circadian clock. Cell. 2015;161(1):84–92. - PubMed
    1. Damiola F, et al. Restricted feeding uncouples circadian oscillators in peripheral tissues from the central pacemaker in the suprachiasmatic nucleus. Genes Dev. 2000;14(23):2950–2961. - PMC - PubMed
    1. Mukherji A, Kobiita A, Chambon P. Shifting the feeding of mice to the rest phase creates metabolic alterations, which, on their own, shift the peripheral circadian clocks by 12 hours. Proc Natl Acad Sci USA. 2015;112:E6683–E6690. - PMC - PubMed

Publication types

MeSH terms

Substances

LinkOut - more resources