. 2015 Dec 2:5:17639.
doi: 10.1038/srep17639.

Limits to the thermal tolerance of corals adapted to a highly fluctuating, naturally extreme temperature environment

Affiliations

Limits to the thermal tolerance of corals adapted to a highly fluctuating, naturally extreme temperature environment

Verena Schoepf et al. Sci Rep. .

Abstract

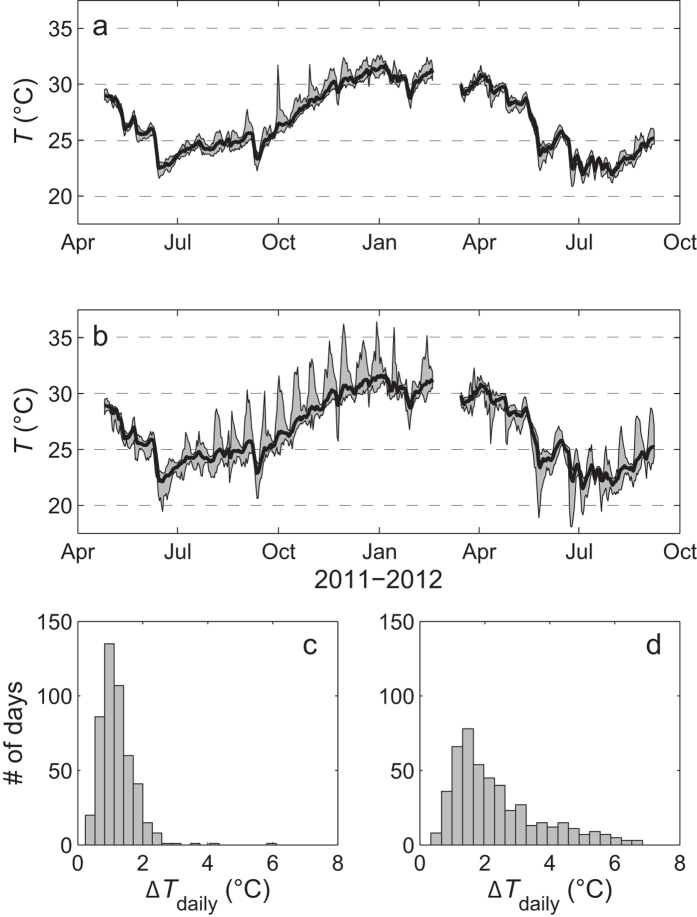
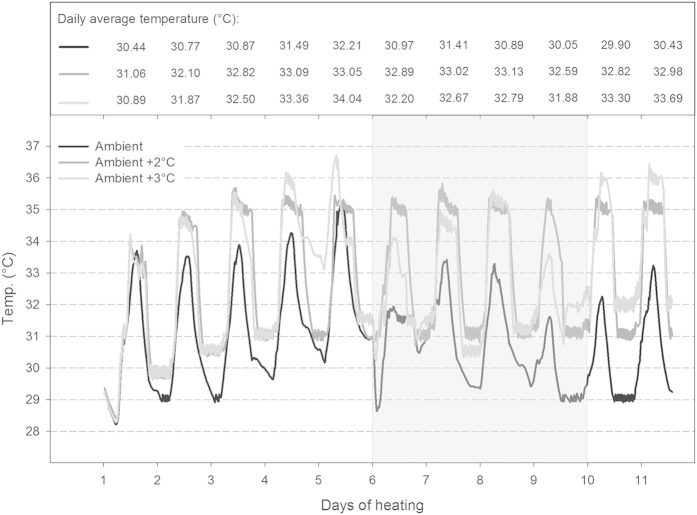
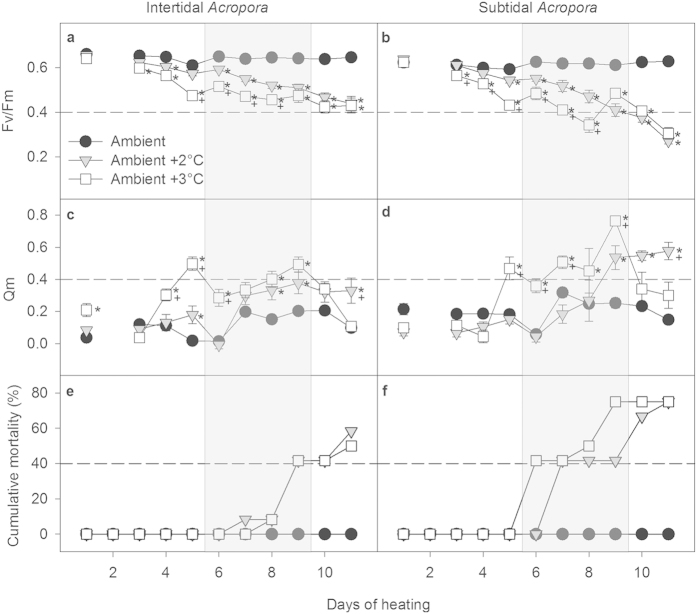
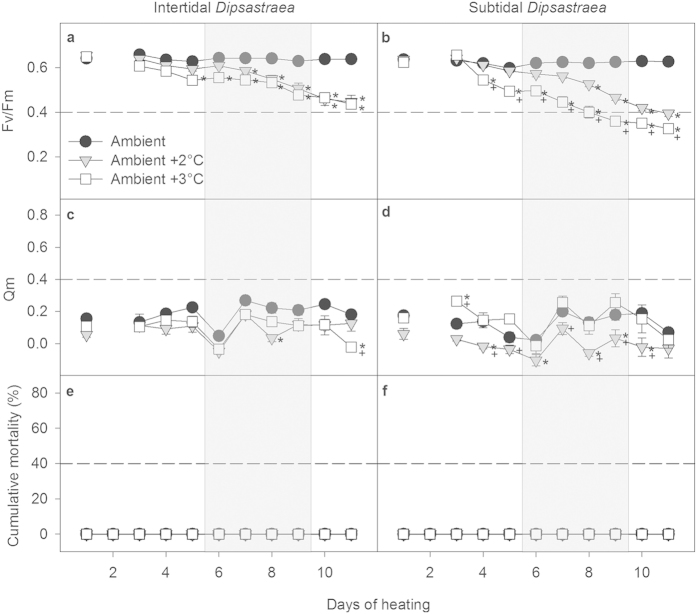
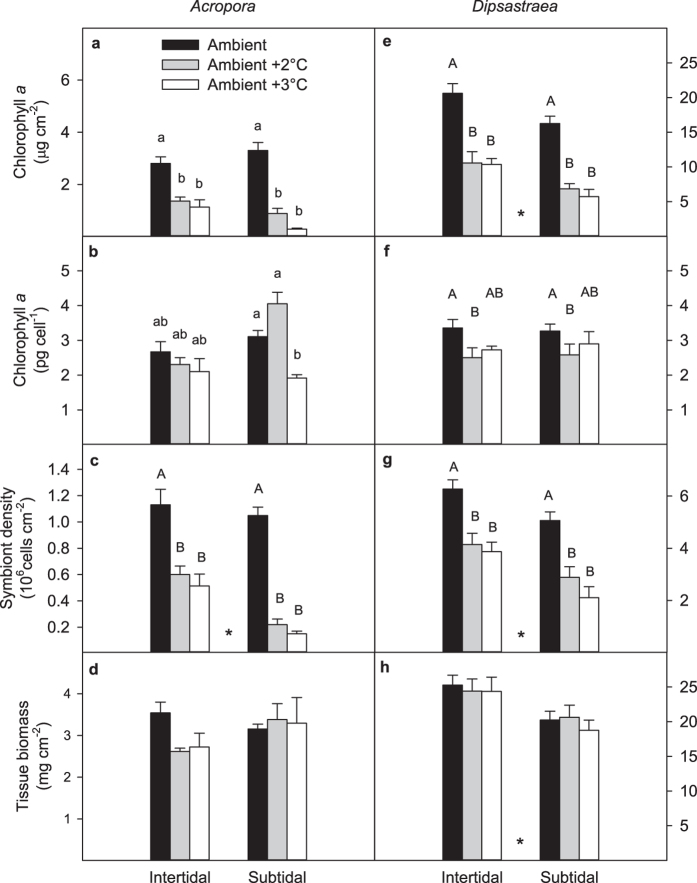
Naturally extreme temperature environments can provide important insights into the processes underlying coral thermal tolerance. We determined the bleaching resistance of Acropora aspera and Dipsastraea sp. from both intertidal and subtidal environments of the naturally extreme Kimberley region in northwest Australia. Here tides of up to 10 m can cause aerial exposure of corals and temperatures as high as 37 °C that fluctuate daily by up to 7 °C. Control corals were maintained at ambient nearshore temperatures which varied diurnally by 4-5 °C, while treatment corals were exposed to similar diurnal variations and heat stress corresponding to ~20 degree heating days. All corals hosted Symbiodinium clade C independent of treatment or origin. Detailed physiological measurements showed that these corals were nevertheless highly sensitive to daily average temperatures exceeding their maximum monthly mean of ~31 °C by 1 °C for only a few days. Generally, Acropora was much more susceptible to bleaching than Dipsastraea and experienced up to 75% mortality, whereas all Dipsastraea survived. Furthermore, subtidal corals, which originated from a more thermally stable environment compared to intertidal corals, were more susceptible to bleaching. This demonstrates that while highly fluctuating temperatures enhance coral resilience to thermal stress, they do not provide immunity to extreme heat stress events.


Figures

Figure 1
Figure 1. Temperature data for the (a) subtidal and (b) intertidal environment from 2011-12.
Histograms show the number of days with a certain daily temperature range (ΔTdaily) in the (c) subtidal and (d) intertidal environment for the same time period. In panels (a,b) the bold black line shows the mean daily temperature, while the hourly max. and hourly min. temperature for each day is shown as a grey envelope around the daily mean.
Figure 2
Figure 2. Temperature profiles and daily average temperature (°C) for each treatment over the course of the bleaching experiment.
Temperature was gradually increased by 0.6 °C per day over the first 3–5 days until the target temperature in the heat stress treatments was achieved. The shaded area indicates days with unusual weather conditions due to storms, high cloud cover and strong winds. Please note that average day and average night temperatures for each treatment are given in Table 1.
Figure 3
Figure 3. Photochemical efficiency (Fv/Fm) (a,b), excitation pressure over photosystem II (Qm) (c,d) and cumulative mortality (e,f) of intertidal and subtidal Acropora aspera.
Mean ± SE are shown for (ad). Asterisks indicate a significant difference from the ambient control treatment, whereas + indicates a significant difference between ambient +2 and +3 °C treatments. The dashed reference lines were added to highlight differences between intertidal and subtidal corals. The shaded area indicates days with unusual weather conditions due to storms, high cloud cover and strong winds.
Figure 4
Figure 4. Photochemical efficiency (Fv/Fm) (a,b), excitation pressure over photosystem II (Qm) (c,d) and cumulative mortality (e,f) of intertidal and subtidal Dipsastraea sp.
Mean ± SE are shown for (ad). Asterisks indicate a significant difference from the ambient control treatment, whereas + indicates a significant difference between ambient +2 and +3 °C treatments. The dashed reference lines were added to highlight differences between intertidal and subtidal corals. The shaded area indicates days with unusual weather conditions due to storms, high cloud cover and strong winds.
Figure 5
Figure 5. Chlorophyll a normalized to (a,e) surface area and (b,f) symbiont cells, symbiont density (c,g) and tissue biomass (d,h) of intertidal and subtidal Acropora aspera and Dipsastraea sp. after 11 experimental days.
Mean ± SE are shown. Asterisks indicate significant effects of environment, whereas upper case letters indicate significant temperature effects. Lower case letters indicate results from Tukey-adjusted multiple pairwise comparisons when there was a significant interaction between environment and temperature. Statistical results in Table S4. Note the different scales for the two corals except in panels (b,f).

References

    1. Hoegh-Guldberg O. et al.. Coral reefs under rapid climate change and ocean acidification. Science 318, 1737–1742 (2007). - PubMed
    1. Glynn P. W. Coral reef bleaching: facts, hypotheses and implications. Global Change Biol. 2, 495–509 (1996).
    1. Hoegh-Guldberg O. & Smith G. J. The effect of sudden changes in temperature, light, and salinity on the population density and export of zooxanthellae from the reef coral Stylophora pistillata Esper and Seriatopora hystrix Dana. J. Exp. Mar. Biol. Ecol. 129, 279–303 (1989).
    1. Muscatine L., McCloskey L. R. & Marian R. E. Estimating the daily contribution of carbon from zooxanthellae to coral animal respiration. Limnol. Oceanogr. 26, 601–611 (1981).
    1. IPCC, Climate Change 2013: The Physical Science Basis. Summary for Policy Makers. (2013) Available at: www.ipcc.ch. (Accessed: 23rd May 2014).

Publication types