. 2016 Jan 12;113(2):E229-38.
doi: 10.1073/pnas.1514282112. Epub 2015 Dec 1.

The K+ channel KIR2.1 functions in tandem with proton influx to mediate sour taste transduction

Affiliations

The K+ channel KIR2.1 functions in tandem with proton influx to mediate sour taste transduction

Wenlei Ye et al. Proc Natl Acad Sci U S A. .

Abstract

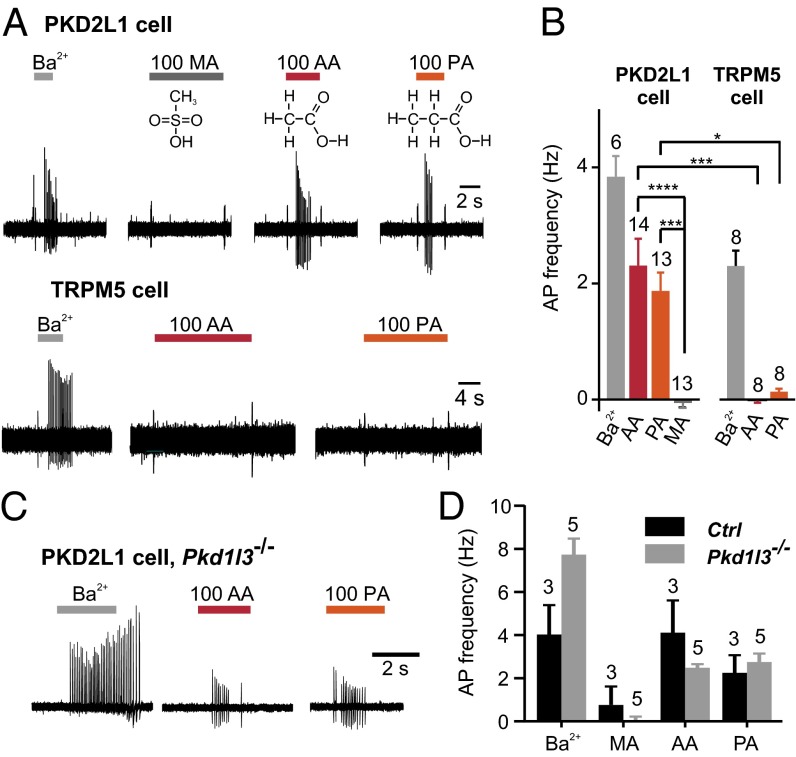
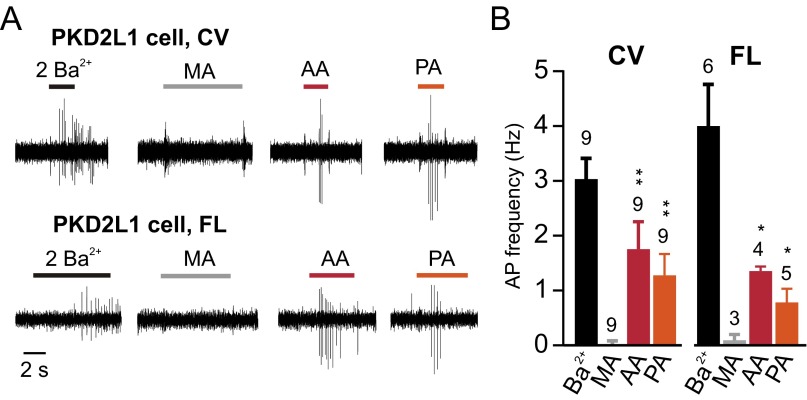
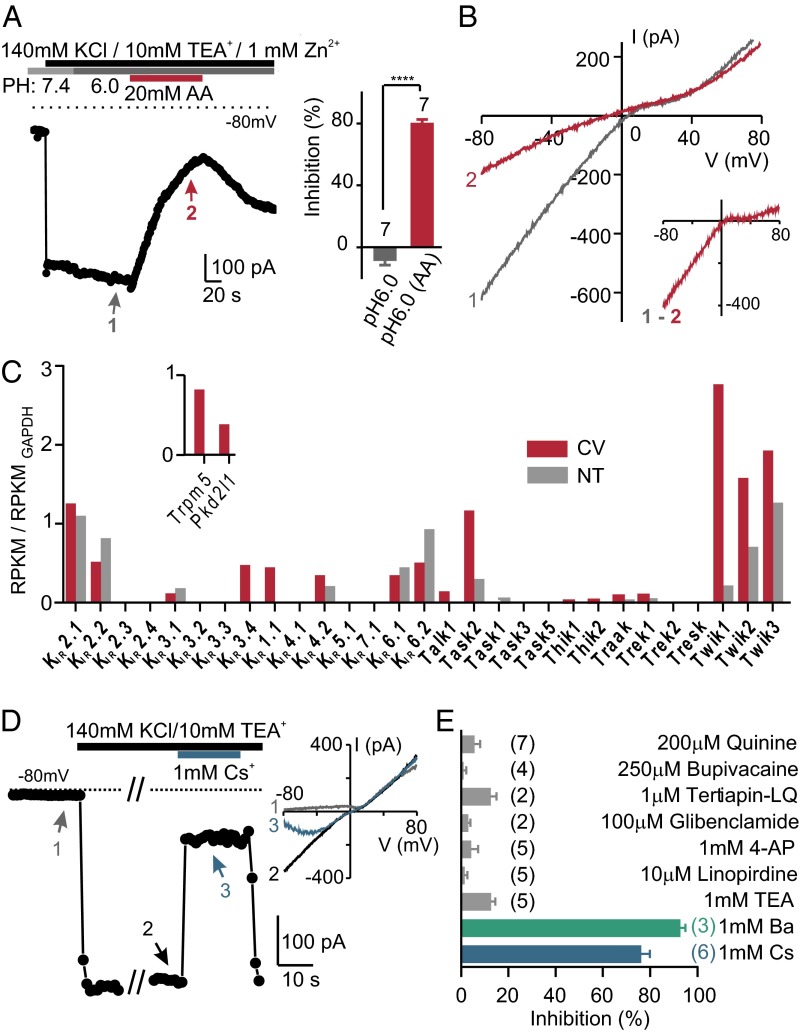
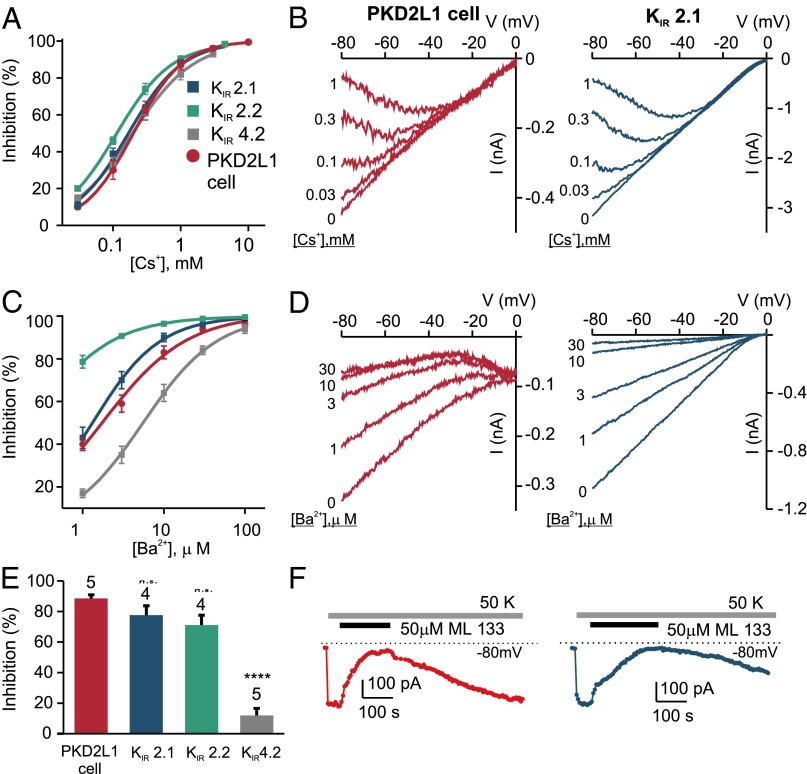
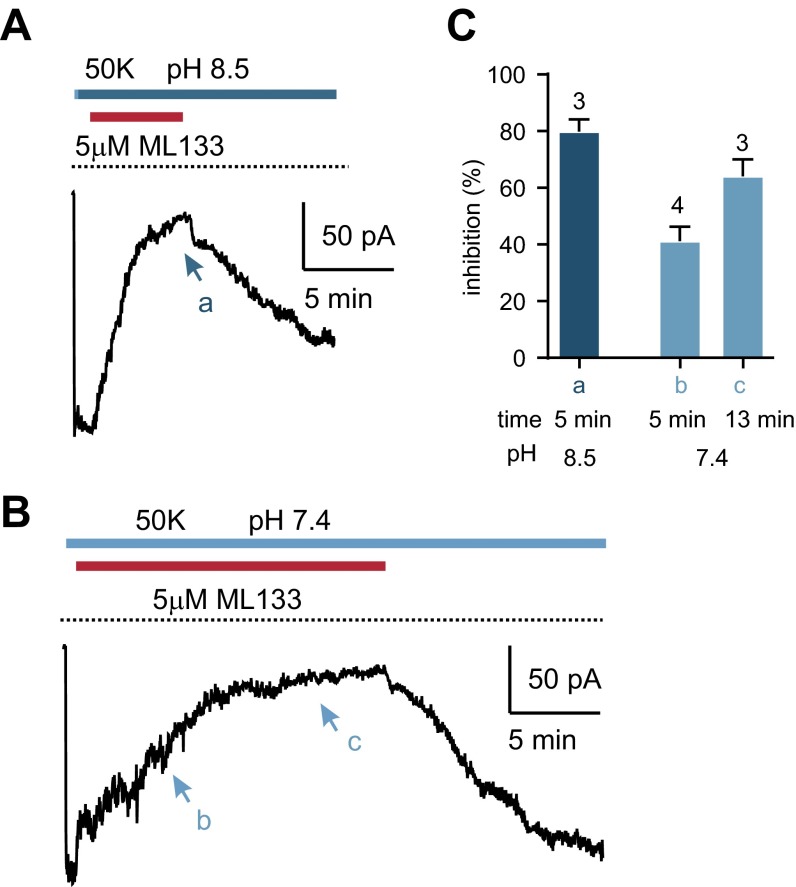
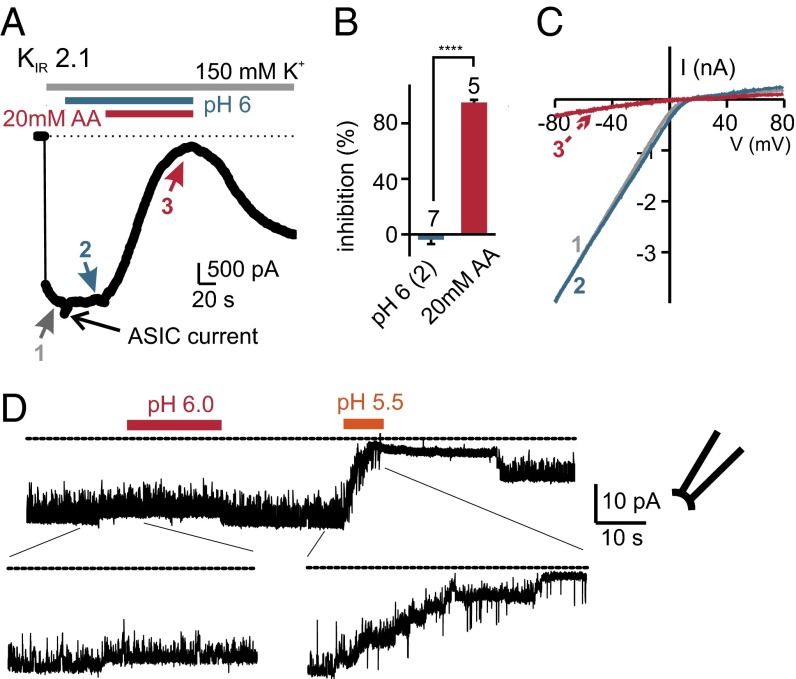
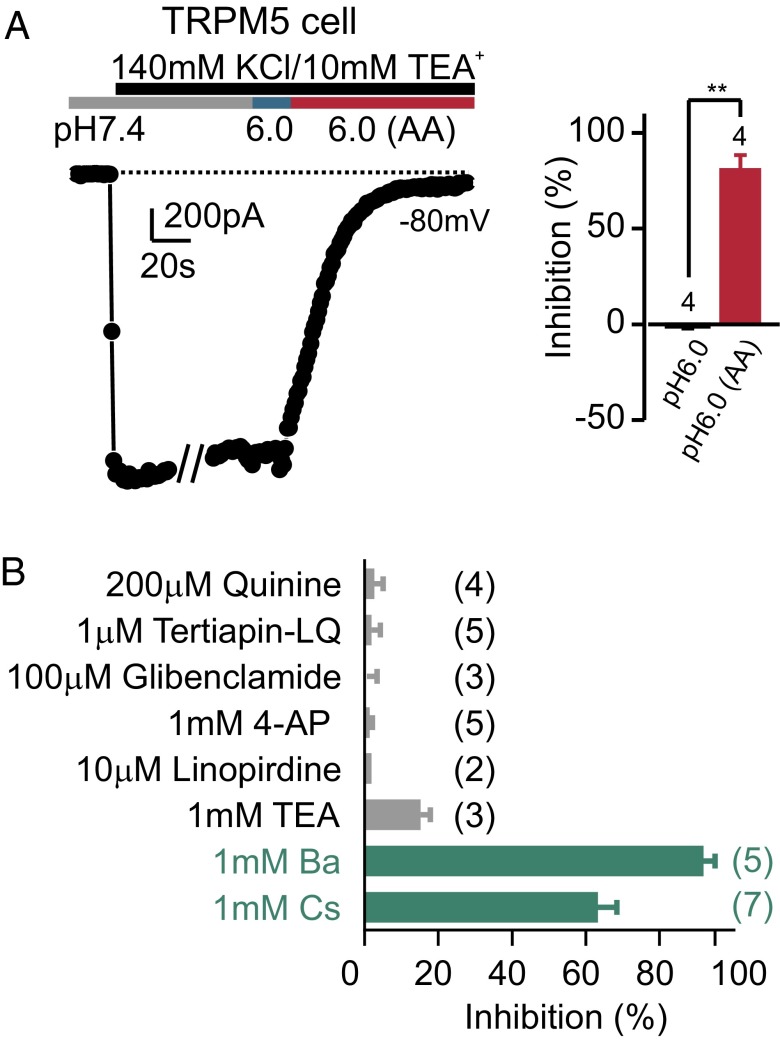
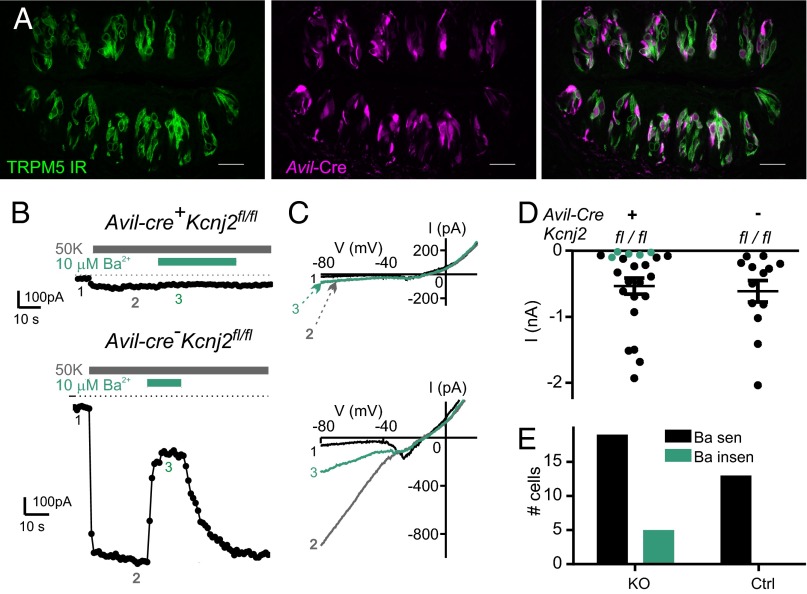
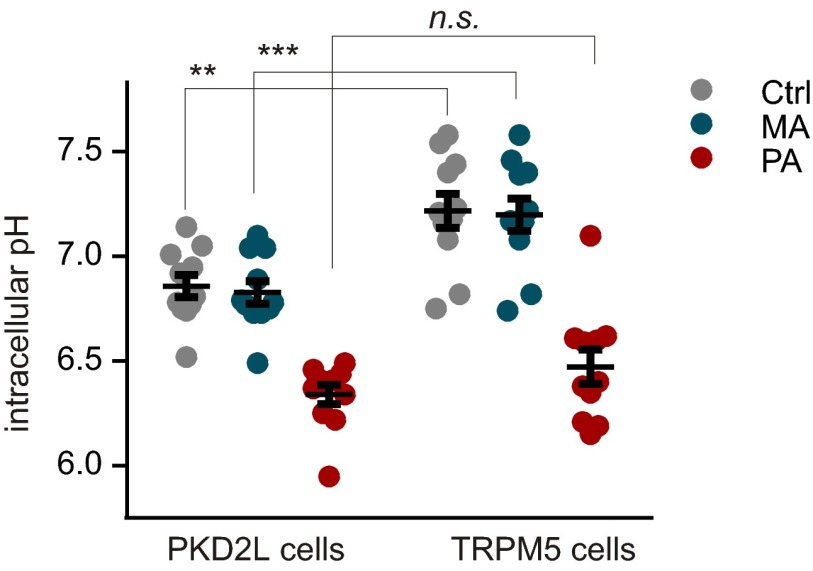
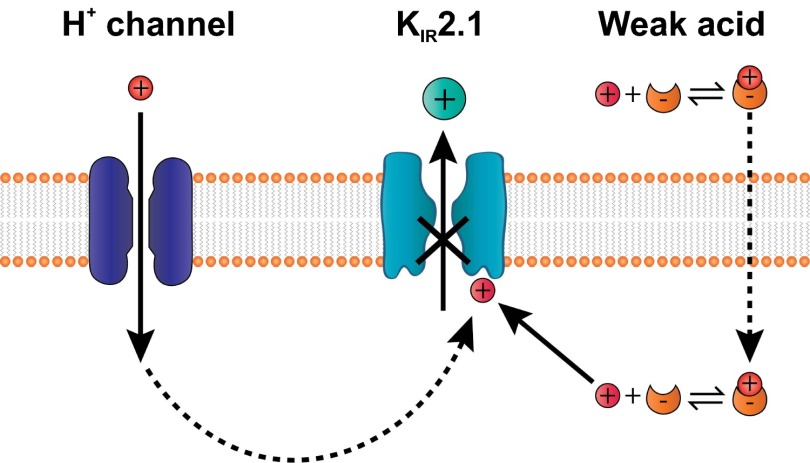
Sour taste is detected by a subset of taste cells on the tongue and palate epithelium that respond to acids with trains of action potentials. Entry of protons through a Zn(2+)-sensitive proton conductance that is specific to sour taste cells has been shown to be the initial event in sour taste transduction. Whether this conductance acts in concert with other channels sensitive to changes in intracellular pH, however, is not known. Here, we show that intracellular acidification generates excitatory responses in sour taste cells, which can be attributed to block of a resting K(+) current. We identify KIR2.1 as the acid-sensitive K(+) channel in sour taste cells using pharmacological and RNA expression profiling and confirm its contribution to sour taste with tissue-specific knockout of the Kcnj2 gene. Surprisingly, acid sensitivity is not conferred on sour taste cells by the specific expression of Kir2.1, but by the relatively small magnitude of the current, which makes the cells exquisitely sensitive to changes in intracellular pH. Consistent with a role of the K(+) current in amplifying the sensory response, entry of protons through the Zn(2+)-sensitive conductance produces a transient block of the KIR2.1 current. The identification in sour taste cells of an acid-sensitive K(+) channel suggests a mechanism for amplification of sour taste and may explain why weak acids that produce intracellular acidification, such as acetic acid, taste more sour than strong acids.

Keywords: gustatory; inward rectifier; potassium channel; proton channel; taste cell.


Conflict of interest statement

The authors declare no conflict of interest.

Figures

Fig. 1.
Fig. 1.
Intracellular acidification evokes action potentials in dissociated PKD2L1 cells but not TRPM5 cells. (A) Action potentials were evoked in a PKD2L1 cell (Upper) but not in a TRPM5 cell (Lower) in response to 100 mM acetic acid (AA) and propionic acid (PA), adjusted to pH 7.4. Control stimuli were 100 mM methanesulfonic acid (MA), or 2 mM Ba2+. Structural formulae of acids are shown. (B) Average data from experiments as in A. The numbers of cells tested are indicated above the bars. By one-way ANOVA, there was a significant difference in the response of PKD2L1 cells to AA and PA compared with MA. Asterisks indicate P value from Tukey’s post hoc test. ***P < 0.001, ****P < 0.0001. By two-way ANOVA, there was a significant difference in the response to weak acids between cell types (P < 0.0001), but no difference between the response to the two weak acids (P = 0.70). Asterisks indicate P value from Tukey’s post hoc test. *P < 0.05, ***P < 0.001. (C) Action potentials evoked in a PKD2L1 cell from CV of a Pkd1l3−/− animal in response to 100 mM AA, 100 mM PA, or 2 mM Ba2+. (D) Average data from experiments as in C. By two-way ANOVA, there was no significant difference in response to acidic stimuli (MA, PA, and AA) across genotypes (P = 0.37).
Fig. S1.
Fig. S1.
Intracellular acidification evokes action potentials in dissociated PKD2L1 cells from both CV and foliate. (A) Action potentials were evoked in a PKD2L1 cells isolated from circumvallate and foliate papillae in response to 100 mM acetic acid (AA) and propionic acid (PA), adjusted to pH 7.4. Control stimuli were 100 mM methanesulfonic acid (MA), or 2 mM Ba2+. (B) Average data from experiments as in A. By two-way ANOVA, there was a significant difference in the response to different acids (MA, AA, and PA) (P < 0.01) but no difference between the two taste fields (P = 0.41). Asterisks indicate P value from Student’s test against MA in each cell type. *P < 0.05, **P < 0.01.
Fig. 2.
Fig. 2.
An inward rectifier K+ current in PKD2L1 cells is inhibited by intracellular acidification. (A) The inward K+ current measured in a PKD2L1 cell was reversibly inhibited by 20 mM acetic acid, pH 6.0, but not by pH 6.0 alone. Average data are shown in the Inset. ****P < 0.0001 using paired two-tailed Student’s t test. (B) I–V relation measure at the times indicated in A. Note that the difference current shows inward rectification. (C) The normalized expression levels of Kcnj (KIR) and Kcnk (K2P) transcripts from deep sequencing of taste and nontaste tissues (average of two samples each). The mapped reads were used to compute reads per kilobase per million reads (RPKM) for each gene, which was further normalized to the RPKM of GAPDH in each sample. Inset shows expression level of two taste cell markers, Trpm5 and Pkd2l1, which were detected only in taste tissue. (D) The inward K+ current from a PKD2L1 cell was reversibly blocked by 1 mM Cs+. Inset shows I–V relation measured at the time points indicated. (E) K+ channel blockers were tested against resting K+ currents in PKD2L1 cells in 100 mM NaCl, 50 mM KCl. The number of cells tested is indicated next to the bars. Of the compounds tested, only 1 mM Ba2+ and 1 mM Cs+ produced a significant block of the inward K+ current (P < 0.0001 by one-way ANOVA followed by Tukey’s post hoc analysis).
Fig. 3.
Fig. 3.
Pharmacological profile of the resting K+ current in PKD2L1 cells implicates KIR2.1. (A–D) The dose dependence of Cs+ and Ba2+ block of inward K+ currents at −80 mV in PKD2L1 cells compared with that of KIR2.1, KIR2.2, and KIR4.2 expressed in HEK 293 cells (mean ± SEM of four to seven cells). (A) By two-way ANOVA, there was a significant difference in sensitivity to Cs+ block between currents in PKD2L1 cells and HEK cells transfected with the KIR channels (P < 0.05). Tukey’s post hoc analysis showed significant difference in Cs+ block between PKD2L1 cells and KIR2.2 at a concentration of 30 μM (P < 0.05). (B) The I–V relationships of the inward K+ current in PKD2L1 cells or HEK cells transfected with KIR2.1 measured in the presence of the indicated concentration of Cs+. Vm was −80 mV, and the voltage was ramped to +80 mV (1 V/s). Note that block is strongly voltage dependent. (C) Two-way ANOVA showed a significant difference (P < 0.0001) in sensitivity to Ba2+ block between currents recorded from PKD2L1 cells and HEK cells transfected with the KIR channels. Tukey’s post hoc analysis showed that KIR2.1 and PKD2L1 currents differed only in response to 3 μM (P < 0.01); at all other concentrations, there was no significant difference. (D) I–V relationships from experiments as in C. (E) Percentage block by ML133 (50 μM) of the inward K+ current in PKD2L1 cells and HEK cells heterologously expressing and KIR channels. By one-way ANOVA, there was a significant difference in ML133 block efficiencies across K+ channel types (P < 0.0001). Asterisks indicate P value compared with PKD2L1 cell using Tukey’s multiple-comparisons test. ****P < 0.0001. (F) Representative data showing the time course of the block by ML133 of the inward K+ current in a PKD2L1 cell and a cell heterologously expressing KIR2.1.
Fig. S2.
Fig. S2.
Block by ML133 of the resting K+ current in PKD2L1 taste cells is pH dependent. (A and B) The block of resting K+ current in PKD2L1 cells by ML133 was extracellular pH dependent. At pH 8.5 (A), the block by 5 μM ML133 was faster than that at pH 7.4 (B). (C) Average data of cells shown in A and B. The time points the block efficiency was measured are arrowed in the trace in A and B.
Fig. 4.
Fig. 4.
KIR2.1 is inhibited by intracellular acidification. (A) The current in a HEK cell heterologously expressing KIR2.1 is inhibited by 20 mM acetic acid at pH 6, but not by pH 6 alone. Note that the pH 6 solution evokes an inward current carried by acid-sensing ion channels (ASIC). (B) Average data from seven cells as in A normalized against the current magnitude before the application of acid. ****P < 0.0001 using paired two-tailed Student’s t test. (C) The I–V relationship of the KIR2.1 current at times indicated in A. (D) Excised patch recording from a KIR2.1 transfected HEK cell in response to acids. The bath solution contained 150 mM KCl, 1 mM EGTA, and 1 mM EDTA. The membrane was held at −80 mV. The application of pH 5.5 completely inhibited channel activity, and channel activity was partially restored by return to neutral pH. Similar results were observed in five cells.
Fig. 5.
Fig. 5.
Tissue-specific knockout of Kcnj2 in PKD2L1 taste cells confirms that KIR2.1 contributes to the inward K+ current. (A) Confocal image of circumvallate taste buds from a Pkd2l1-Cre::Rosa26tdT mouse. Tomato reporter expression is displayed in magenta. PKD2L1 immunoreactivity is displayed in green. Cre expression efficiency, as determined by the tomato reporter fluorescence, is ∼79% in circumvallate taste tissue. (All scale bars: 30 μm.) (B) A representative recording from a PKD2L1 cell from a Pkd2l1-Cre::Pkd2l1-YFP::Kcnj2fl/fl mouse (cKO; Upper) and a recording from a control cell, from a mouse where Kcnj2 is not floxed (Lower). In the cKO, the K+ current induced by 50 mM K+ is small, and not sensitive to 1 or 10 μM Ba2+. (C) The I–V curves at indicated time points in B. (D) K+ current magnitudes in PKD2L1 taste cells from cKO mice and controls. Black symbols indicate the current was sensitive to 1 μM Ba2+ (>15% block); red indicates not sensitive (<5% block); gray are cells not tested with Ba2+. One-way ANOVA followed by Tukey’s post hoc test, **P < 0.01, ***P < 0.001. (E) Same data as in D showing the distribution of Ba2+-sensitive currents across genotypes. The difference is significant by one-tailed χ2 test (P < 0.05).
Fig. S3.
Fig. S3.
Pkd2l1-Cre mouse strain. (A) Map of the Pkd2l1-cre plasmid used to generate the transgenic mouse strain. (B) A Venn diagram of count data comparing PKD2L1 immunoreactivity (red circle) to Pkd2l1-Cre tomato reporter positive cells (yellow circle). Overlap shown in orange. Cre reporter efficiency, as determined by the tomato reporter fluorescence, is ∼79% in the circumvallate taste tissue. (C) Confocal image z stacks of circumvallate taste buds from a triple-transgenic Pkd2l1-Cre, RosaTdt, Trpm5-GFP mouse. Tomato reporter expression is displayed in magenta, and Trpm5-driven GFP fluorescence is displayed in green. Tomato reporter fluorescence and Trpm5-driven GFP fluorescence do not coincide. (All scale bars: 30 µm.)
Fig. S4.
Fig. S4.
Floxed Kcnj2 is specifically excised in Cre-expressing tissue. (A) The design for Cre-loxP dependent tissue-specific knockout of Kcnj2, the gene that encodes KIR2.1. Exon2 of Kcnj2, which covers the entire coding sequence, was floxed. Primers that were used to genotype animals are indicated. (B) PCR of genomic DNA from circumvallate (CV) and nontaste (NT) tissues of mice representing the three genotypes indicated. The left panel shows the results of genotyping the mice using the indicated primer pairs. Note that, for this analysis, the source of the genomic DNA is irrelevant. The right panel shows the results of a PCR designed to test for the deletion of exon 2, which is only expected to occur in taste tissue from Pkd2l1-Cre::Kcnj2fl/fl mice. The same template DNA was used as in the right panel, which therefore serves as a control for this experiment.
Fig. 6.
Fig. 6.
The resting K+ current in TRPM5 cells is sensitive to intracellular acidification. (A) Inward K+ currents measured at −80 mV from a TRPM5 cell are sensitive to intracellular acidification (pH 6.0 solution containing 20 mM acetic acid) but not extracellular acidification (6.0 solution buffered with 10 mM Mes). Average data are shown in the right panel. **P < 0.01 using paired two-tailed Student’s t test. (B) The pharmacological profiling of the resting K+ current in TRPM5 taste cells. The inhibition efficiency was tested in 50 mM K+ solutions at −80 mV as for the PKD2L1 cells. Of the blockers tested, only 1 mM Ba2+ and 1 mM Cs+ produced a significant block of the inward K+ current (P < 0.0001 by one-way ANOVA followed by Tukey’s post hoc analysis).
Fig. 7.
Fig. 7.
Tissue-specific knockout of Kcnj2 in TRPM5 taste cells. (A) Confocal image of circumvallate taste buds from an Avil-Cre::Rosa26tdT::Pkd2l1-YFP mouse. Tomato reporter expression is displayed in magenta. TRPM5 immunoreactivity is displayed in green. Cre is expressed in ∼71% of TRPM5 cells as determined by expression of the tomato reporter fluorescence in TRPM5-immunoreactive cells. (Scale bar: 30 μm.) (B) A representative PKD2L1 cell from a Avil-Cre::Trpm5-GFP::Kcnj2fl/fl mouse (cKO; Upper) and a Cre control cell. In the taste cell from the cKO mouse, the K+ current is small, and insensitive to 10 μM Ba2+. (C) I–V curves at time points indicated in B. (D) Magnitude of the K+ current in TRPM5 taste cells from cKO mice and WT controls. Black symbols indicate the current was sensitive to 10 μM Ba2+ (>40% block); green indicates that the current was not sensitive (<25% block). (E) Same data as in D showing the distribution of Ba2+-sensitive currents across genotypes (P < 0.05; one-tailed χ2 test).
Fig. S5.
Fig. S5.
Distribution of Avil-Cre in taste cells. (A–C) Confocal images of the same field of circumvallate taste buds from an Avil-Cre::Rosa26tdT::Pkd2l1-YFP mouse as in Fig. 7. The reporter expression is displayed in magenta, and YFP immunoreactivity, which reflects the expression pattern of Pkd2l1, is displayed in green. Note that there is very little overlap between Cre reporter expression and and YFP immunoreactivity (C). (Scale bar: 30 μm.) (D) A Venn diagram of count data showing TRPM5-immunoreactive cells (green circle, as in Fig. 7A), pkd2l1-YFP–immunoreactive cells (blue circle), and Avil-Cre tomato reporter-positive cells (red circle). The Cre reporter was detected in ∼71% of TRPM5 cells and 8% of PKD2L1 cells.
Fig. S6.
Fig. S6.
The intracellular pH to which TRPM5 cells are acidified by weak acids is similar to that of PKD2L1 cells. Scatter plot of intracellular pH from imaging of cells loaded with pHrodo Red. Cells were sequentially exposed to bath solution (Tyrode’s), 100 mM methanesulfonic acid (MA), and 100 mM propionic acid (PA), all pH 7.4. Intracellular pH was calibrated as described in Methods. By two-way ANOVA, there was a significant difference across the conditions (P < 0.0001) and across cell types (P < 0.01). Post hoc analysis with Sidak’s test corrected for multiple comparisons showed no significant difference between cell types in response to the weak acid, PA (P = 0.43). As previously reported (21), the resting pH of the two cell types was significantly different as was the pH in the presence of MA. Note that MA was used as a control and was not expected to cause a change in pH from resting conditions. **P < 0.01, ***P < 0.001.
Fig. 8.
Fig. 8.
Reduction in the magnitude of the resting K+ currents makes TRPM5 cells sensitive to intracellular acidification. (A) K+ (100 mM) elicits significantly larger currents in TRPM5 cells than in PKD2L1 cells and that 10 μM Ba2+ reduces the current to a similar magnitude as in PKD2L1 cells. (B) Scatter plot of current magnitudes from cells as shown in A. Tests for significant difference of TRM5 cells with or without Ba2+ were against PKD2L1 cells. **P < 0.01 using two-tailed Student’s t test. (C) With the preapplication of 10 μM Ba2+, robust action potentials were elicited by 100 mM propionic acid at pH 7.4. (D) The average data of cells as in C. **P < 0.01 using paired one-tailed Student’s t test.
Fig. 9.
Fig. 9.
Block of the resting K+ current by proton entry through a proton conductance provides a mechanism for amplification of the sour sensory response. (A) The inward K+ current in a PKD2L1 cell, but not a TRPM5 cell, was inhibited by extracellular solution adjusted to pH 6 when 2 mM Zn2+, a blocker of the taste cell proton conductance, was omitted from the solution, but not when it was included. (B) Average data from experiments as in A at time points indicated by the arrows, normalized against the current magnitude before the application of the pH 6 solution. Asterisks indicate the significant difference compared with pH 6 plus 2 mM Zn2+ in PKD2L1 cells, or pH 6 alone in TRPM5 cells. (C) Action potential recorded in cell-attached mode from a PKD2L1 taste cell in response to the indicated stimuli. Neither the pH 7.0 stimulus nor a low concentration of AA (0.1 mM of protonated acid) could effectively evoke action potentials, but together they elicited robust firing. (D) Average data from experiments as in C. By two-way ANOVA, there was a significant difference between Ctrl and AA groups (P < 0.01). Asterisks indicate results of Sidak’s multiple-comparison test. *P < 0.05, ***P < 0.001.
Fig. 10.
Fig. 10.
A two-component mechanism for sour taste transduction. In the proposed model, H+ entering through an H+ channel inhibits the K+ channel. The K+ channel can also be inhibited by H+ that is shuttled by weak acids. Both the proton entry and the block of the K+ channel contribute to membrane depolarization, which drives action potentials and release of neurotransmitter.
Fig. S7.
Fig. S7.
KCNK1 does not contribute to the resting K+ current in PKD2L1 cells. (A) The current recorded from a KCNK1-AA-GFP–transfected HEK cell under conditions designed to unmask the current. Note that in 130 mM Rb+ (with 20 mM TEA), the current magnitude was much larger than that in 130 mM K+ extracellular solution (also with 20 mM TEA) as previously reported (57). Cs+ was not an effective blocker of KCNK1 current (58). (B) Same experiments as in A performed with a KIR2.1-transfected cell. Note that the current in Rb+ is much smaller than that in K+ solutions, and that Cs+ blocks the current effectively. (C) The current recorded in a PKD2L1 taste cell. Note that the current magnitude in Rb+ is smaller than that in K+, similar to the KIR2.1-mediated current. (D) The ratios of current in 130 mM Rb+ (IRb+) to that in 130 mM K+ (IK+) for KCNK1-AA, KIR2.1, and PKD2L1 taste cells. Using these data, we estimated the contribution of KCNK1 to the taste cell K+ current by rearranging a set of linear functions assuming that the inward currents in high Rb+ and K+ are generated solely from the contributions of KCNK1 and KIR2.1 (SI Methods). This calculation showed that KCNK1 accounts for no more than 1% of the resting K+ current.

Comment in

  • Sour taste finds closure in a potassium channel.
    Challis RC, Ma M. Challis RC, et al. Proc Natl Acad Sci U S A. 2016 Jan 12;113(2):246-7. doi: 10.1073/pnas.1523319113. Epub 2015 Dec 30. Proc Natl Acad Sci U S A. 2016. PMID: 26719421 Free PMC article. No abstract available.

Similar articles

Cited by

References

    1. Huang AL, et al. The cells and logic for mammalian sour taste detection. Nature. 2006;442(7105):934–938. - PMC - PubMed
    1. Chaudhari N, Roper SD. The cell biology of taste. J Cell Biol. 2010;190(3):285–296. - PMC - PubMed
    1. Liman ER, Zhang YV, Montell C. Peripheral coding of taste. Neuron. 2014;81(5):984–1000. - PMC - PubMed
    1. Thomas CJ, Lawless HT. Astringent subqualities in acids. Chem Senses. 1995;20(6):593–600. - PubMed
    1. Lyall V, et al. Decrease in rat taste receptor cell intracellular pH is the proximate stimulus in sour taste transduction. Am J Physiol Cell Physiol. 2001;281(3):C1005–C1013. - PubMed

Publication types

MeSH terms